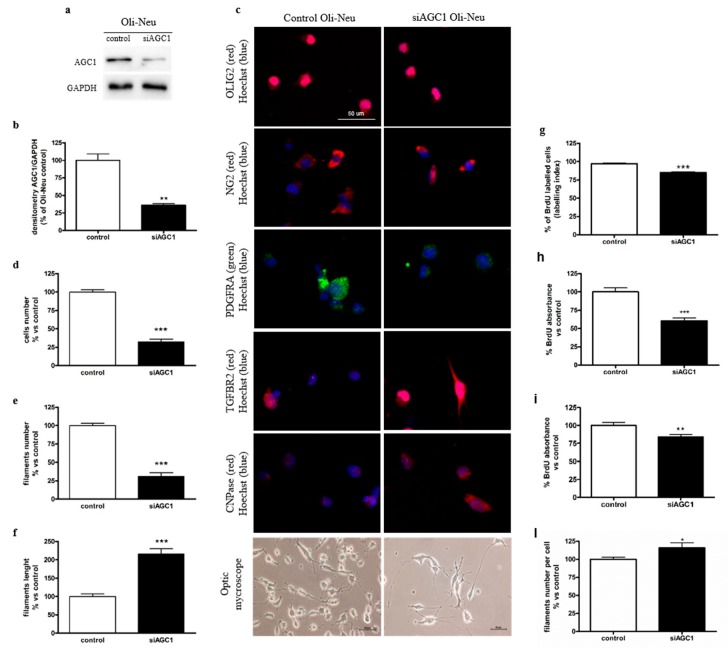
Figure 1.
Spontaneous oligodendrocyte precursor cell (OPC) differentiation and OPC proliferation defects in aspartate glutamate carrier 1 (AGC1)-silenced Oli-Neu cells. Western blot analysis (a) and relative densitometries (b) of AGC1 expression in Oli-Neu cells, in which a partial silencing of the mouse AGC1 gene has been produced (siAGC1). Densitometry is the ratio between the expression level of AGC1 and GAPDH (Glyceraldehyde 3-phosphate dehydrogenase) as reference loading control and is expressed as percentage vs. control Oli-Neu cells. Immunofluorescence staining and optical microscopy images (c) of control and siAGC1 Oli-Neu cells. Nuclei were labelled with Hoechst, while Olig2, NG2, PDGFαR, TGFβR2 and CNPase were used as specific markers for Oli-Neu cells. Analyses for cells number (d), total filaments number (e), filaments length (f) and filaments number per cell (l) calculated with Fiji ImageJ2 software. Scale bar: 50 μm. BrdU immunofluorescence of control and siAGC1 Oli-Neu cells with nuclei staining with Hoechst (blue) and BrdU positive-cell count analysis expressed as labelling index (g). BrdU incorporation by ELISA assay (enzyme-linked immunosorbent assay) in control and siAGC1 Oli-Neu cells after 6 (h) and 24 h (i) BrdU incubation. Scale bar: 100 μm. Values are the mean ± SE of 3 independent experiments performed in triplicate, * p < 0.05, ** p < 0.01, *** p < 0.001 compared to control Oli-Neu cells, Student’s t-test.

