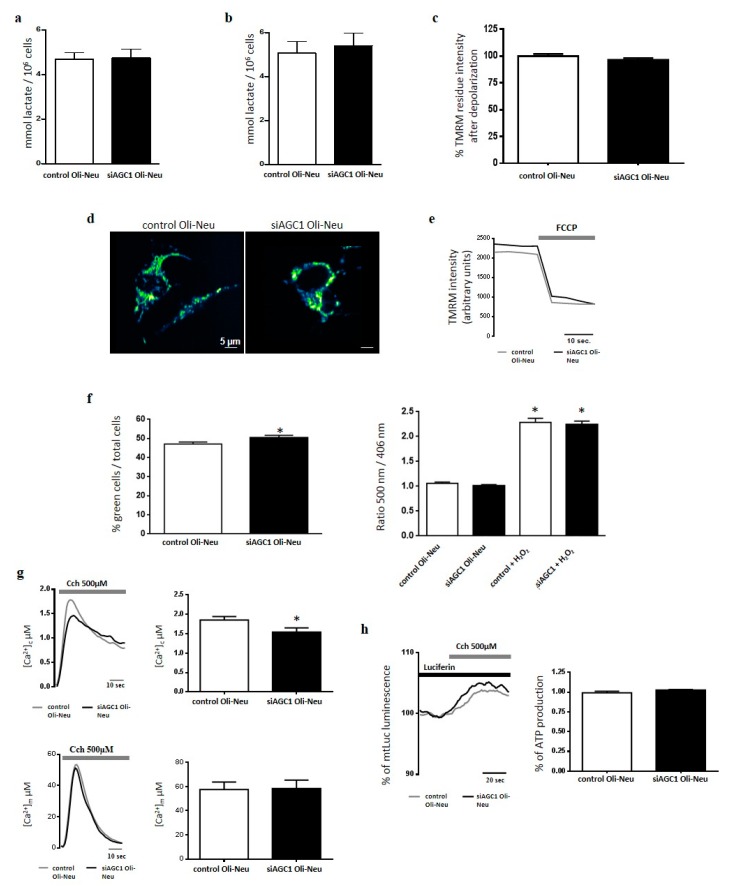
Figure 2.
Effect of AGC1 down-regulation on lactic acid release, mitochondrial membrane potential, ROS generation and [Ca2+] homeostasis of Oli-Neu cells. Lactic acid was quantified in conditioned complete SATO mediumharvested from control Oli-Neu (white bars) or siAGC1-Oli-Neu cells (black bars) in the absence (a, undifferentiated cells) or presence (b, differentiated cells) of 1 mM dibutyryl-cAMP for 48 h. Values are the means ± SD from 3 independent experiments performed in triplicate. (c) Δψm was measured by fluorescence microscopy in control Oli-Neu (white bars) or siAGC1-Oli-Neu cells (black bars) incubated in minimal essential medium supplemented with 1 g/L glucose. Cells were loaded with 20 nM TMRM (tetramethyl rhodamine methyl ester) for 30 min at 37 °C and fluorescence intensities were imaged every 5 s with a fixed 20 milliseconds exposure time. Carbonyl cyanide-4-(trifluoromethoxy)phenylhydrazone (FCCP), an uncoupler of oxidative phosphorylation, was added after 12 acquisitions to completely collapse the electrical gradient established by the respiratory chain (d,e). Data are means ± SD of TMRM percentage intensities normalized to values before agonist stimulation in three independent experiments. (f) Cytosolic and mitochondrial hydrogen peroxide were measured in control-Oli-Neu (white bars) or siAGC1-Oli-Neu cells (black bars) loaded with 5 μM CM-H2DCFDA (left panel) or expressing the ratiometric H2O2-sensitive mt-HyPer protein (right panel). (g) Control-Oli-Neu (grey lines) or siGC1-OliNeu cells (black lines) expressing chimeric aequorins targeted to cytosol (upper panels) or mitochondria (lower panels) were perfused in KRB supplemented with glucose 1 g/L and stimulated with Carbachol 500 µM. Shown traces are representative of the following measurements: for control OliNeu cells, [Ca2+]c peak values, 1.54 ± 0.14 μM, n = 20; [Ca2+]m peak values, 58,4 ± 6.2 μM, n = 20; for siAGC1-OliNeu cells, [Ca2+]c peak values, 1.85 ± 0.09 μM, n = 20; [Ca2+]m peak values, 57,6 ± 4.1 μM, n = 20. (h) ATP-dependent luminescence was measured in control Oli-Neu (grey lines) or siAGC1-Oli-Neu cells (black lines) cells expressing the mitochondrially targeted luciferase (mtLuc) perfused in KRB supplemented with glucose 1 g/L and challenged with Carbachol 500 µM. Data are expressed as percentage of mtLuc light output increase from cells normalized to the prestimulatory values. Shown traces are representative of the following results: for control Oli-Neu cells, 101 ± 8%, n = 20 of the prestimulatory value; for siAGC1-OliNeu cells: 103 ± 9%, n = 20.

