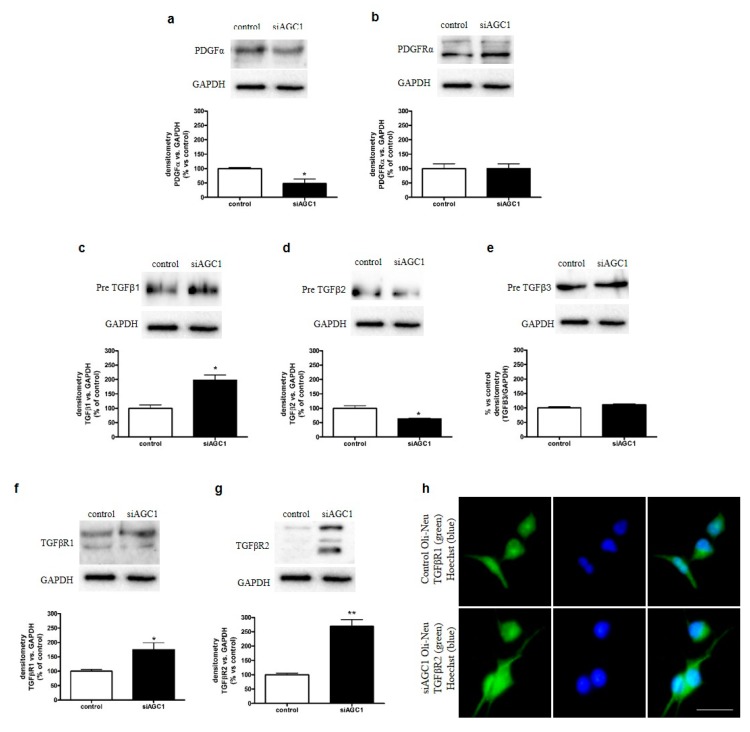
Figure 3.
Dysregulation of Platelet-Derived Growth Factor α (PDGFα) and Transforming Growth Factor β (TGFβ) pathways in AGC1-silenced Oli-Neu cells. Western blot analysis and relative densitometries of PDGFα (a), PDGFαR (b), TGFβ1 (c), TGFβ2 (d), TGFβ3 (e), TGFβR1 (f) and TGFβR2 (g) expression in control and siAGC1 Oli-Neu cells. Densitometry is the ratio between the expression level of each protein and GAPDH as reference loading control and is expressed as percentage vs. control Oli-Neu cells. (h) Immunofluorescence staining of TGFβR1 in control and siAGC1 Oli-Neu cells (nuclei were labelled with Hoechst). Scale bar: 50 μm. Values are the mean ± SE of 3 independent experiments performed in triplicate, * p < 0.05, ** p < 0.01, compared to control Oli-Neu cells, Student’s t-test.

