Figure 5.
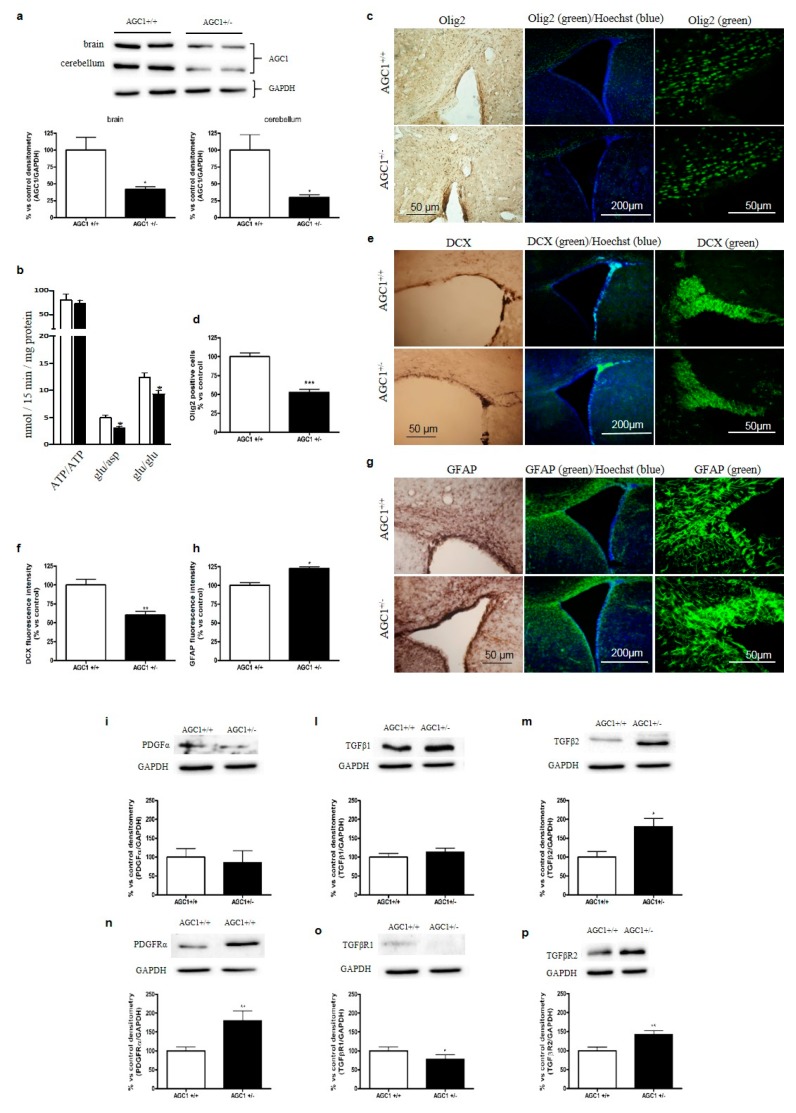
Proliferation deficits and dysregulation of PDGFα and TGFβ pathways in 21-day old AGC1+/− mice. Western Blot analysis of AGC1 expression in 21-day old AGC1+/+ (n = 8) and AGC1+/− (n = 8) mice in brain and cerebellum (a). GAPDH was used as reference loading control. Respective densitometric analyses are shown below. Bars represent the mean ± SE of 3 independent experiments performed in triplicate, * p < 0.05, compared to AGC1+/+ mice, t-test of Student. (b) Transport activities in brain mitochondria. [14C]ATP ext/ATP int (0.1 mM ext/20 mM ext), [14C]aspartate ext/glutamate int (0.05 mM ext/20 mM ext) and [14C]glutamate ext /glutamate int (0.1 mM ext/20 mM ext) were assayed in liposomes reconstituted with mitochondrial protein extracts isolated from AGC1+/+ (white column) and AGC1+/− (black column) mouse brains. Transport activities were measured 30 min after the addition of the radiolabelled substrates. Data are the mean ± SD, n = 6, * p < 0.01 compared to liposomes reconstituted with AGC1+/+ mitochondrial extracts, one-way analysis with Bonferroni’s post-hoc test. Immunohistochemical and immunofluorescence analysis of Olig2+ cells (c), as well as doublecortin (DCX) (e) and Glial fibrillary acidic protein (GFAP) (g), respectively markers of OPCs, immature neurons and astrocytes, in the corpus callosum and subventricular zone of 21-day old AGC1+/+ and AGC1+/− mice (scale bar = 300 μM). Cell count and fluorescence intensity analysis showed a significant reduction for Olig2+ (d) and DCX+ (f), while GFAP+ cells (h) were increased in AGC1+/− mice. Bars are expressed as percentage vs. AGC1+/+ and represent the mean ± SE of three experiments for Olig2 and the mean ± SE of two experiments for DCX and GFAP. * p < 0.05, *** p < 0.001 compared to AGC1+/+ mice. Student’s t-Test. Western blot analysis and relative densitometries of PDGFα (i), TGFβ1 (l), TGFβ2 (m), PDGFαR (n), TGFβR1 (o) and TGFβR2 (p) expression in 21-day old AGC1+/+ and AGC1+/− mice. Densitometry is the ratio between the expression level of each protein and of GAPDH as reference loading control and is expressed as percentage vs. AGC1+/+. Values are the mean ± SE of 3 independent experiments performed in triplicate, * p < 0.05, ** p < 0.01, compared to AGC1+/+, Student’s t-test.

