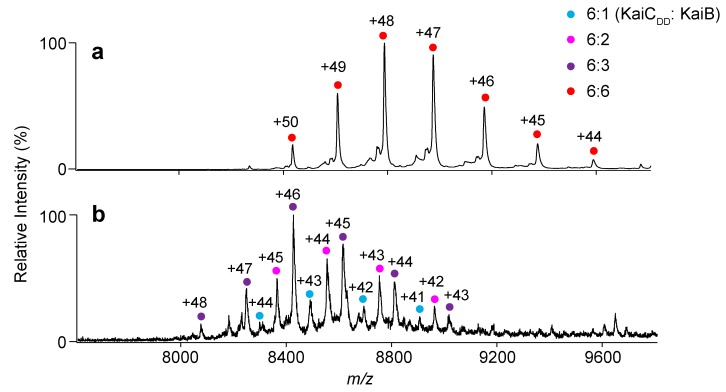
Figure 2.
Native MS analysis of KaiB–KaiC complex formation. Mass spectra of mixtures of TeKaiCDD and (a) TeKaiB10–108 or (b) TeKaiB10–108/DD at a 1:3.5 molar ratio (TeKaiCDD to TeKaiB). The cyan, magenta, purple, and red circles show the ion series of 6:1, 6:2, 6:3, and 6:6 complexes of TeKaiCDD and TeKaiB mutants, respectively.

