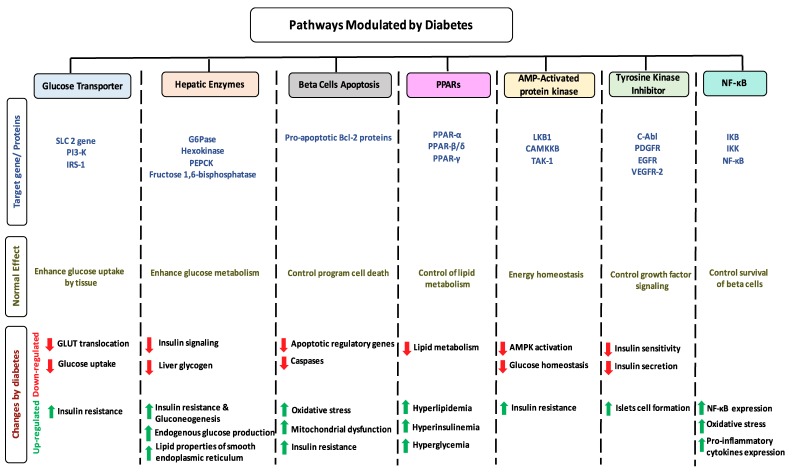
Figure 1.
Schematic illustration of seven selected pathways modulated by diabetes. The figure is divided into seven columns and three rows. The column headings represent the pathways, while the rows heading represent: target genes/proteins for each pathway (blue), the overview physiological effect of these genes on pathways (Dark yellow), and changes occur on these pathways modulated by diabetes.

