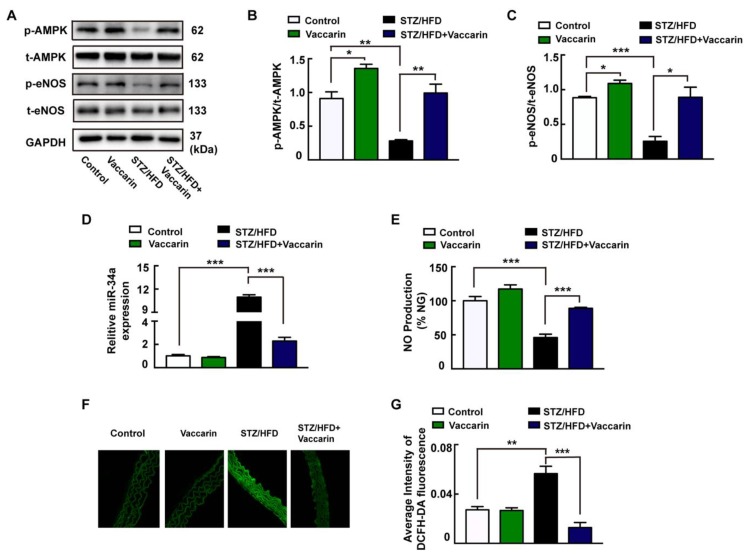
Figure 6.
VAC repressed endothelial dysfunction and suppressed ROS/AMPK/miRNA-34a/eNOS signaling cascade in vivo. (A) Representative blots showing aortic protein expressions of p-AMPK and p-eNOS. Column groups showing that the quantification of p-AMPK/t-AMPK (B) and p-eNOS/t-eNOS (C). (D) The expression of miR-34a. (E) Serum NO generation detected with ELISA. (F) Representative microscopic scans of ROS (

