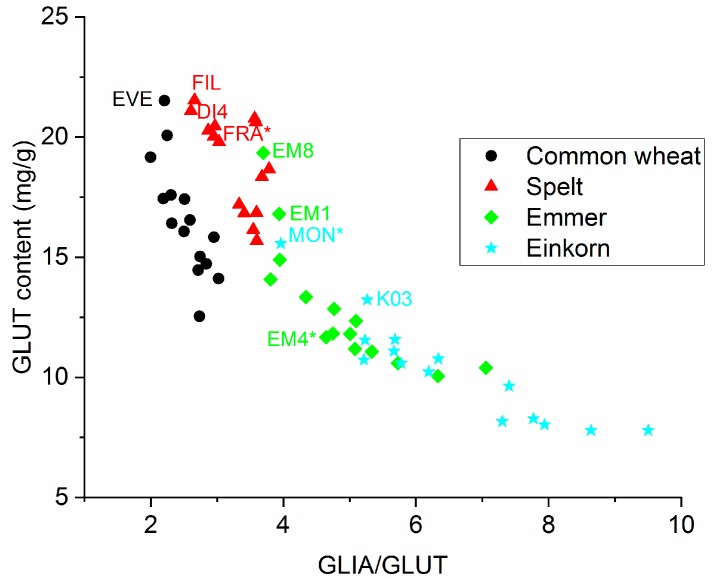
Figure 5.
Scatter plot of glutenin (GLUT) content versus ratio between gliadins and glutenins (GLIA/GLUT) to identify cultivars with good predicted baking performance. The cultivars marked with an asterisk had already been identified as cultivars with good baking performance in our previous study [11]. Only samples with good predicted baking performance are labeled with abbreviations for better visibility. Abbreviations of cultivars are given in Table S1.

