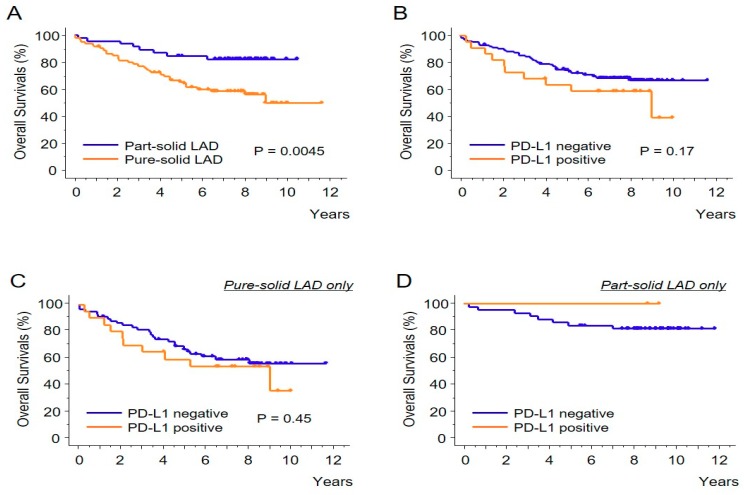
Figure 3.
The Kaplan-Meier curves showing the overall survivals. Comparisons of the part-solid LADs versus the pure-solid LADs (A) and PD-L1 positive tumors (1% or higher) versus negative tumors (B) are shown. The prognostic impact of PD-L1 expression status was also analyzed in pure-solid LADs (C) and in part-solid LADs (D).

