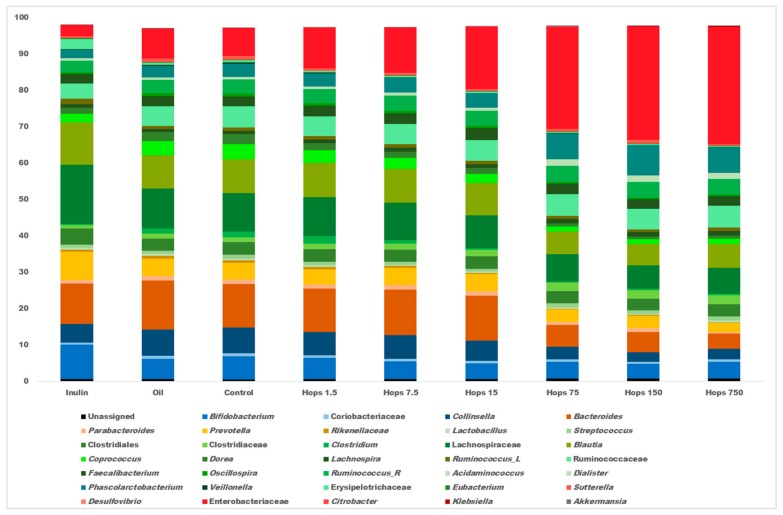
Figure 2.
Average (n = 3) relative abundance of bacterial taxa in each separate fermentation (all time points). Only genera present at greater than 0.5% relative abundance in at least one sample are displayed. Genera bar colors correspond to the phyla they belong to—Actinobacteria, blue; Bacteroidetes, orange; Firmicutes, green; Proteobacteria, red; Verrucomicrobia, grey. Ruminococcus_R, Ruminococcaceae family; Ruminococcus_L, Lachnospiraceae family.

