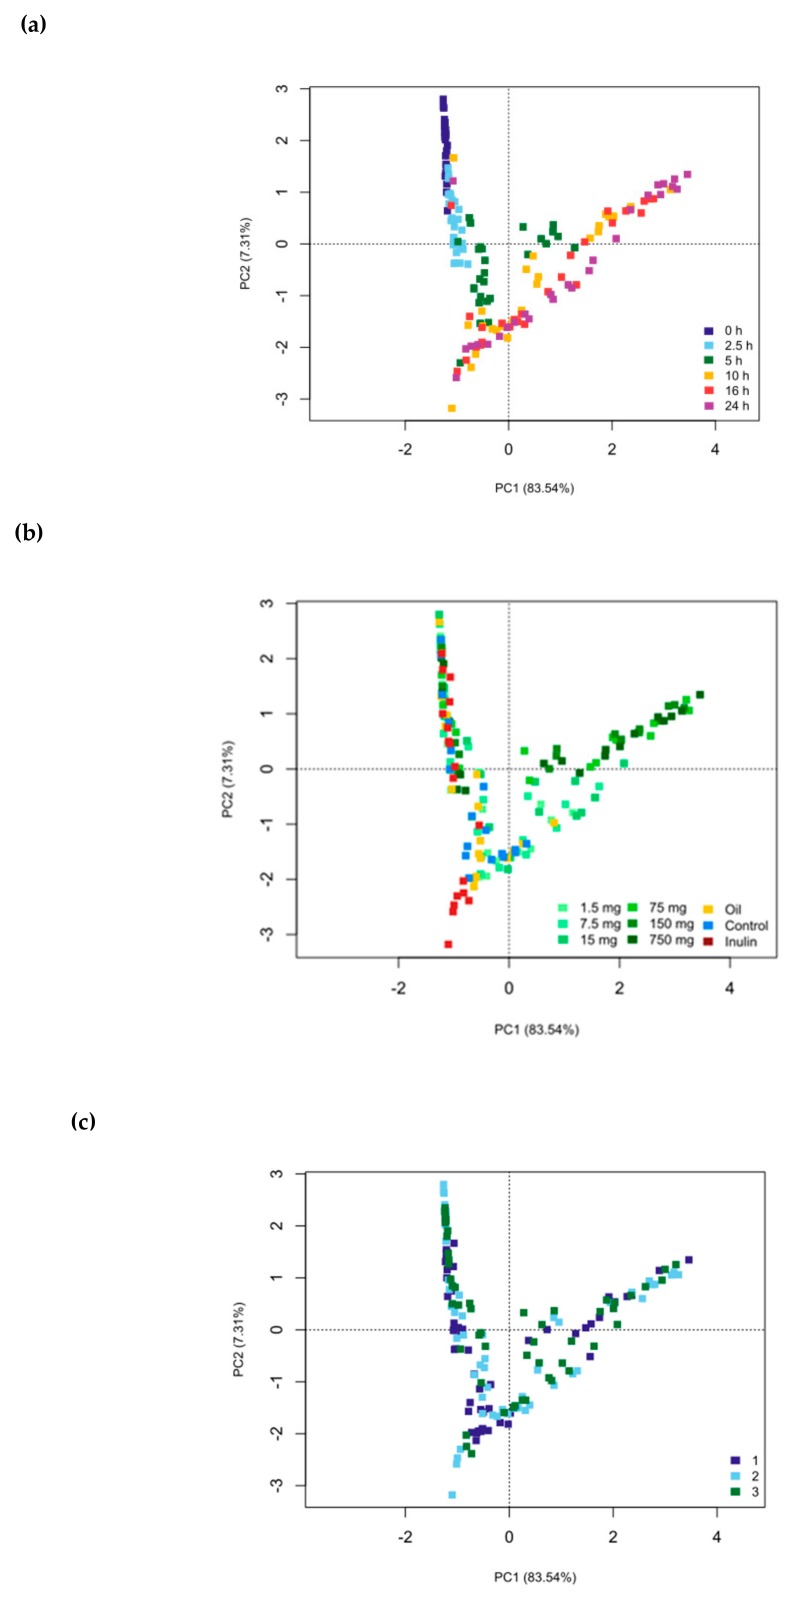
Figure 3.
16S rRNA gene sequencing data depicted as genus-level Euclidean principal coordinates analysis (PCoA) plots separated by time point (a) (p < 0.001, R2 = 43.4%), substrate (b) (p < 0.001, R2 = 28.5%) and fermentation replicates (c) (p = 0.3248, R2 = 1.4%). Significance (p ≤ 0.05) was determined by the non-parametric Adonis statistical test (9999 permutations).

