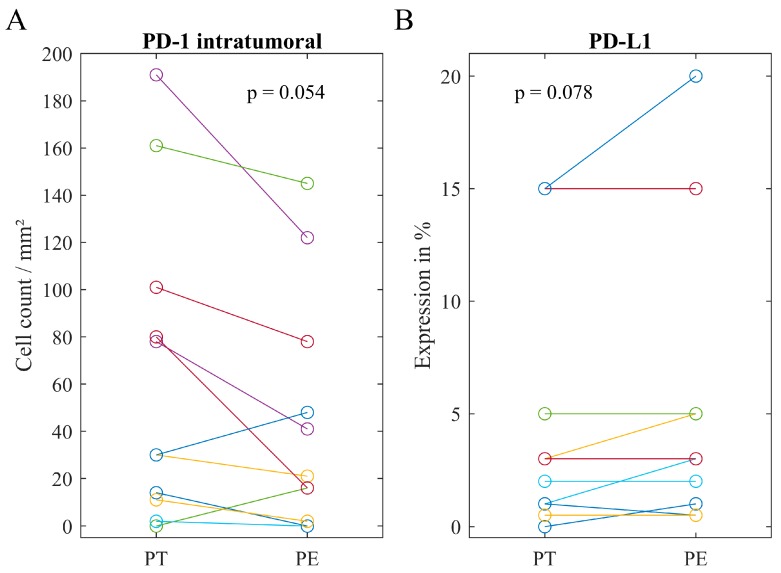
Figure 2.
Scatter plots comparing immune cell phenotypes between primary tumor and the corresponding peritoneal lesion. (A) Counts of intratumoral PD-1+ (programmed cell-death protein 1) cells have been in tendencies higher in primary tumor. (B) PD-L1 (programmed cell-death ligand 1) expression has been slightly higher in peritoneum. p-value calculated by Wilcoxon signed-rank test. Cases with the value ‘0’ in primary tumor and peritoneum (A) n = 3 (B) n = 2 have been excluded from graph, but not from calculation.

