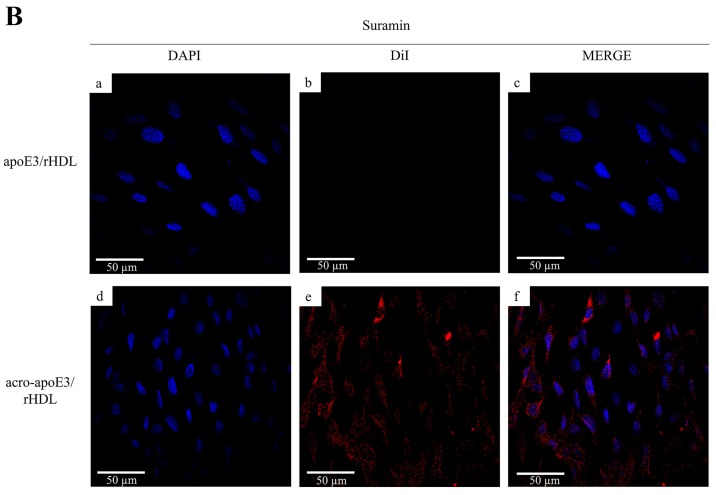
Figure 5.
Uptake of apoE3/rHDL and acro-apoE3/rHDL by bEnd.3 cells. Uptake was followed by direct fluorescence in the presence of excess LDL (A) or suramin (B). Uptake experiments were carried out in the presence of 100× excess LDL or 2mM suramin and apoE3/rHDL (a–c) or acro-apoE3/rHDL (d–f) (apoE3 concentration: 3 µg/mL). The panels show fluorescence of DAPI (a,d), DiI (b,e), and Merge (c,f).


