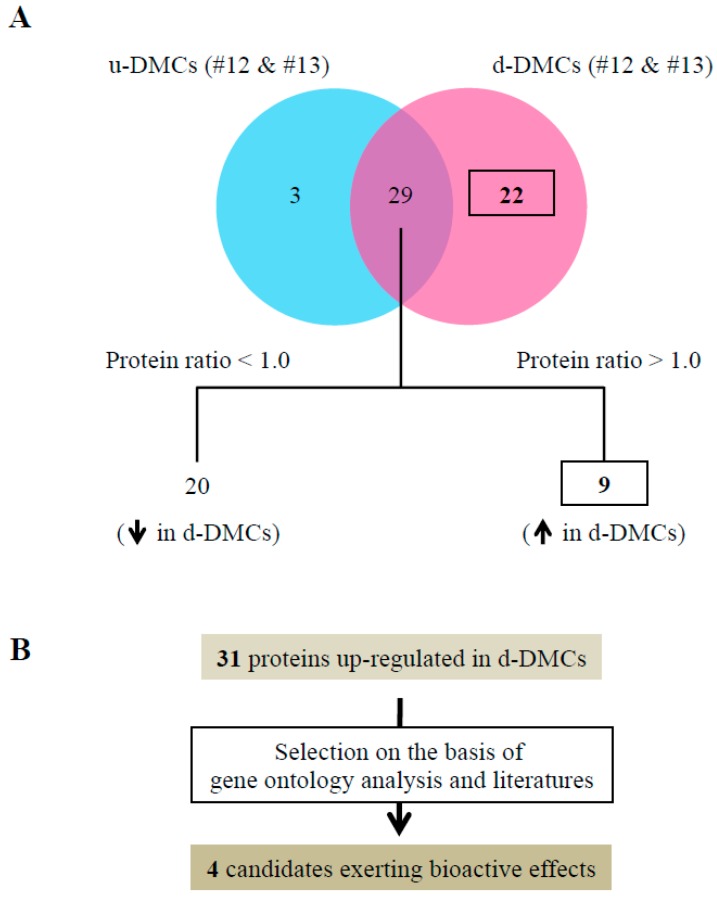
Figure 4.
Proteomic analysis of fractions and selection of critical molecules. (A) Venn diagrams showing the results of protein identification of fractions #12 and #13 from u-DMCs or d-DMCs. Label-free proteome quantification was performed using MaxQuant software to calculate the protein ratio among 29 proteins common to both samples. Nine proteins showing a high protein ratio (>1) among 29 common proteins and 22 proteins unique to the fractions of d-DMCs were specifically increased in d-DMCs (protein ratios were calculated by the following formula: [protein ratio] = [intensity of protein in the fraction of d-DMCs]/[intensity of protein in the fraction of u-DMCs]). (B) Workflow to select candidate critical molecules for wound healing promotion. Four proteins (Table 1) were selected among 31 increased proteins based on gene ontology analysis and previous studies.

