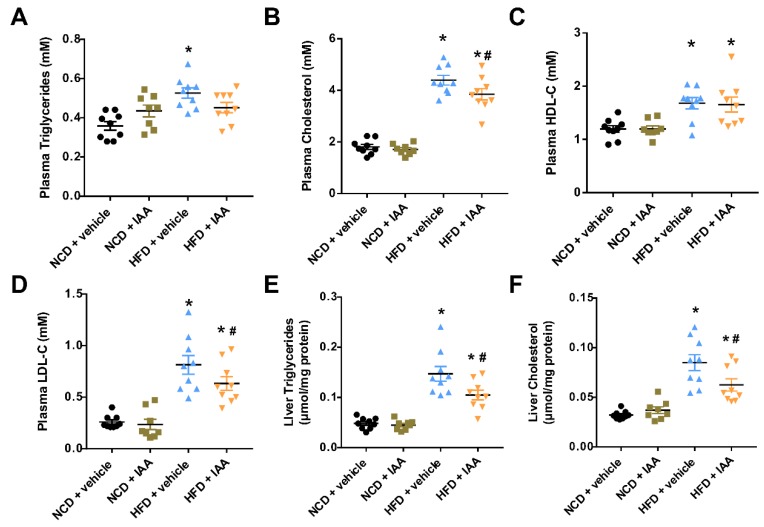
Figure 2.
Lipid contents in the plasma and liver of vehicle or indole-3-acetic acid (IAA)-treated mice subjected to normal chow diet (NCD) or high-fat diet (HFD). (A–D) display plasma total triglycerides, total cholesterol, HDL-C, and LDL-C, respectively. (E,F) show the levels of liver triglyceride and cholesterol. Results are described as the mean ± standard error of the mean. n = 8–9. * p < 0.05 vs. NCD + vehicle; # p < 0.05 vs. HFD + vehicle.

