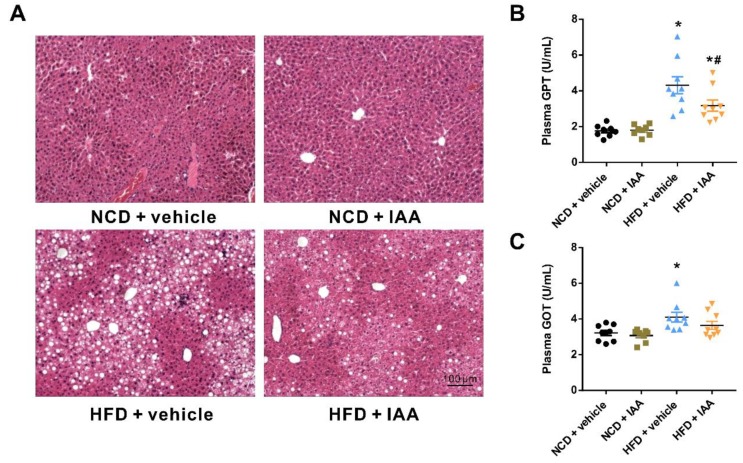
Figure 3.
Protective effects of indole-3-acetic acid (IAA) on high-fat diet (HFD)-induced liver injury. (A) Representative images of hematoxylin & eosin staining results for liver tissue sections. Scale bar represents 100 µm. (B) Plasma glutamic-pyruvic transaminase (GPT) and (C) glutamic oxalacetic transaminase (GOT) levels. Data are presented as the mean ± standard error of the mean. n = 8–9. * p < 0.05 vs. NCD + vehicle; # p < 0.05 vs. HFD + vehicle.

