Figure 3.
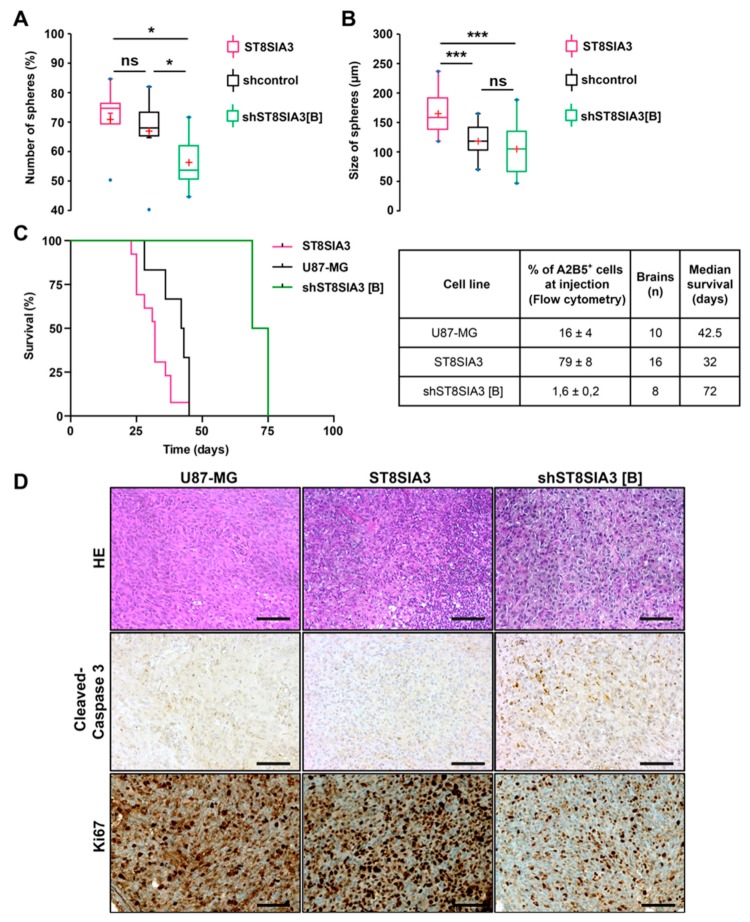
ST8SIA3 enhances in vitro clonogenicity and in vivo tumorigenicity. (A) Self-renewal capacity was evaluated by limiting dilution assay in 96-well plates. Box plots show the percentage of spheres formed after 8 days of culture for U87-shcontrol, U87-ST8SIA3, and U87-shST8SIA3 [B] cell lines. (B) Mean diameter of spheres recorded for U87-shcontrol, U87-ST8SIA3, and U87-shST8SIA3 [B] after 8 days of culture. Non-parametric Wilcoxon–Mann–Whitney test shows * p < 0.05 and *** p < 0.001. ns: non-significant. The lower and upper edges of each box represent the first and third quartiles, respectively, while the horizontal line within the box indicates the median. The vertical length of the box represents the interquartile range (IQR). The most extreme sample values (within a distance of 1.5 IQR from the median) are the endpoints of the extending lines. (C) Kaplan–Meier survival plot of mice intracerebrally grafted with U87-MG, U87-ST8SIA3, or U87-shST8SIA3 [B] cells. Time is expressed in days since time of cell graft. Groups were compared using the Log-rank test. The table recaps the percentage of A2B5+ cells before injection, number of brains analyzed, and median survival of mice. (D) Representative hematoxylin–eosin (HE), cleaved-caspase 3, and Ki67 staining of tumors obtained after U87-MG, U87-ST8SIA3, or U87-shST8SIA3 [B] orthotopic injections. Scale bar: 100 μm.

