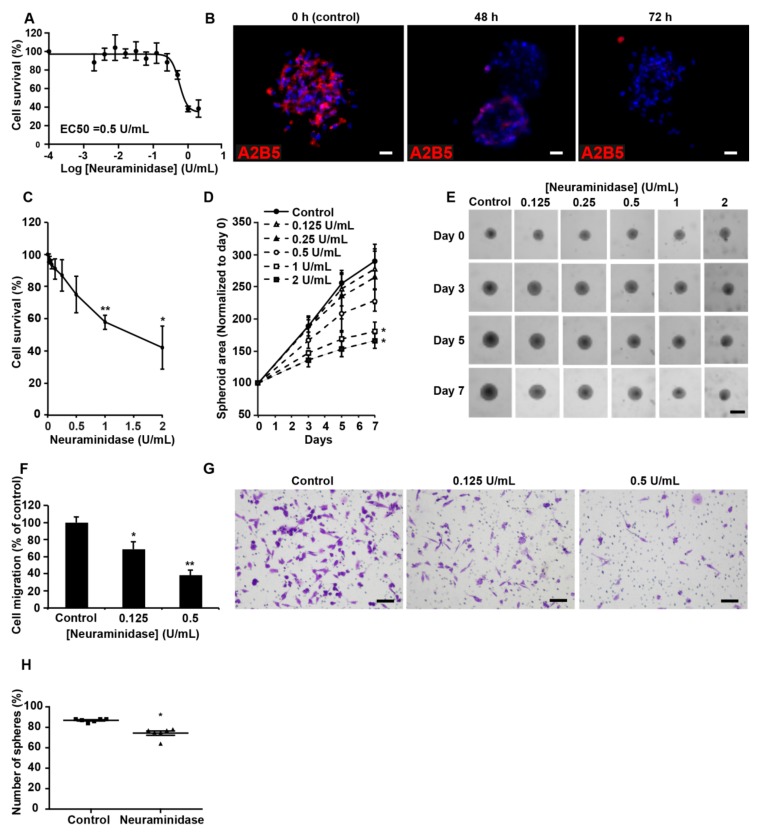
Figure 4.
Suppression of A2B5 immunoreactivity in high-A2B5-expressing cells induces a decrease in cell proliferation, migration, and clonogenicity. (A) A dose–response cytotoxicity assay of neuraminidase (10−4 to 1 U/mL) was conducted for 72 h to assess the viability of GBM9 cells grown as a 2D monolayer (n = 3). (B) A2B5 staining (in red) on the GBM9 sphere control or that treated with 0.5 U/mL neuraminidase (EC50) for 48 and 72 h. (C) A dose-response cytotoxicity assay of neuraminidase (0 to 2 U/mL) was conducted for 7 days to assess the viability of GBM9 cells grown as 3D spheroids (n = 3). (D) The GBM9 spheroid area was measured during the 7 days after neuraminidase treatment and normalized to Day 0. (E) Representative phase contrast images at Days 0, 3, 5, and 7 of the control and treated GBM9 spheroids. (F) Quantification of GBM9 cell migration using the transwell assay after neuraminidase treatment at 0.125 and 0.5 U/mL (EC50) for 6 h. The mean + SEM values of four independent experiments, each performed in duplicate, are shown. (G) Representative phase contrast images of control and treated migrating GBM9 cells. Scale bar = 50 μm. (H) Self-renewal capacity was evaluated by limiting dilution assay in 96-well plates. The scatter plot shows the percentage of spheres formed after 8 days of culture of GBM9 cells treated or not with 0.5 U/mL neuraminidase (EC50). Non-parametric Wilcoxon-Mann-Whitney test shows * p < 0.05, ** p < 0.01.

