Figure 5.
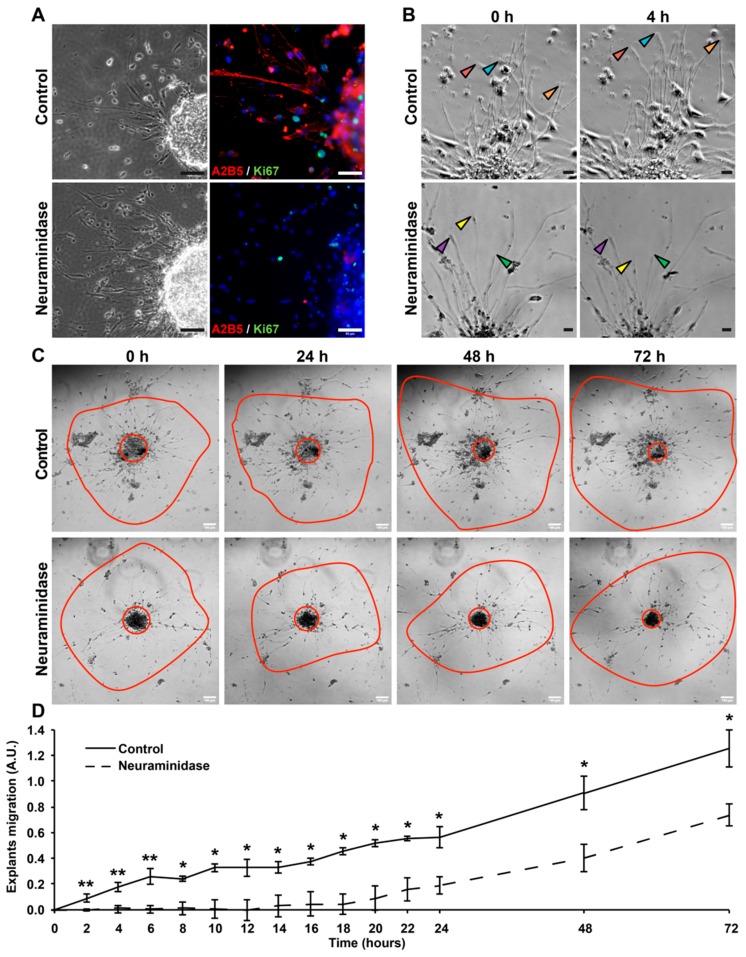
Neuraminidase affects the migration of human GBM explants. (A) Phase-contrast images and immunofluorescent double-staining of A2B5 (in red) and Ki67 (in green) of control and 72 h treated (1 U/mL neuraminidase) explants. Cell nuclei are counterstained in blue. Scale bar = 50 μm. (B) Using time-lapse video microscopy at regular intervals, cells migrating radially from explants in basic conditions or with 1 U/mL neuraminidase were accurately observed for 72 h. Arrows allow us to follow the migration of some cells. Scale bar = 50 μm. (C) Representative phase contrast images taken over time of control and treated (1 U/mL neuraminidase) explants. For each explant, the central red circle allows us to visualize the explant’s core, while the outer red line shows the cell migration area. Scale bar = 100 μm. (D) The distance of migrating cells from the explant’s core was quantified in basic conditions or with 1 U/mL neuraminidase (n = 3 experiments). Non-parametric Wilcoxon–Mann–Whitney test shows * p < 0.05 and ** p < 0.01. ns: non-significant.

