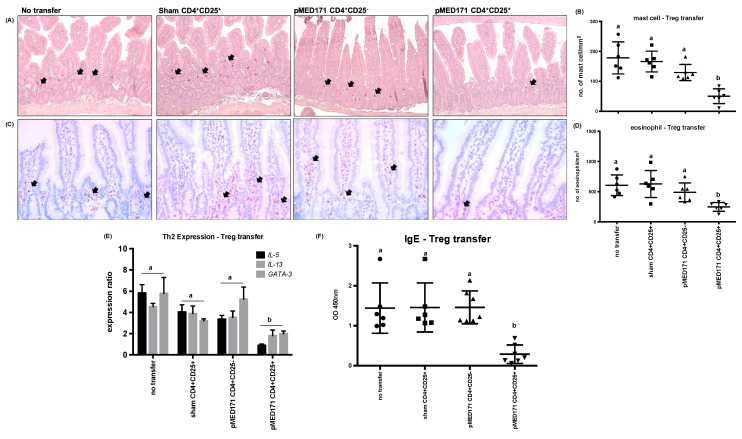
Figure 5.
Immunological responses with Treg cell transfer. (A) Representative photomicrographs of mast cells (arrows indicate mast cells stained red in chloroacetate esterase staining; magnification = 200X). (B) Quantification of mast cells per mm2 of crypt area. (C) Representative photomicrographs of anti-MBP-stained eosinophils (arrows indicate eosinophils stained brown in IHC; magnification = 400X). (D) Quantification of eosinophils per mm2 of villus. (E) Local expression of Th2 cytokines and transcription factors in the small intestine detected by qPCR and (F) levels of serological tropomyosin-specific IgE measured by ELISA. Note that only the transfer of CD4+CD25+Treg cells from pMED171-treated donors led to significant reduction in intestinal inflammation, Th2 responses, and allergen-specific IgE titer. Data are shown as individual data points denoted by different symbols for each experimental group with mean ± SD. Statistical differences among different experimental groups were determined by Bonferroni post-test after one-way ANOVA; groups denoted by the same alphabet are not significantly different, while those denoted by different alphabets are statistically different (p < 0.05).

