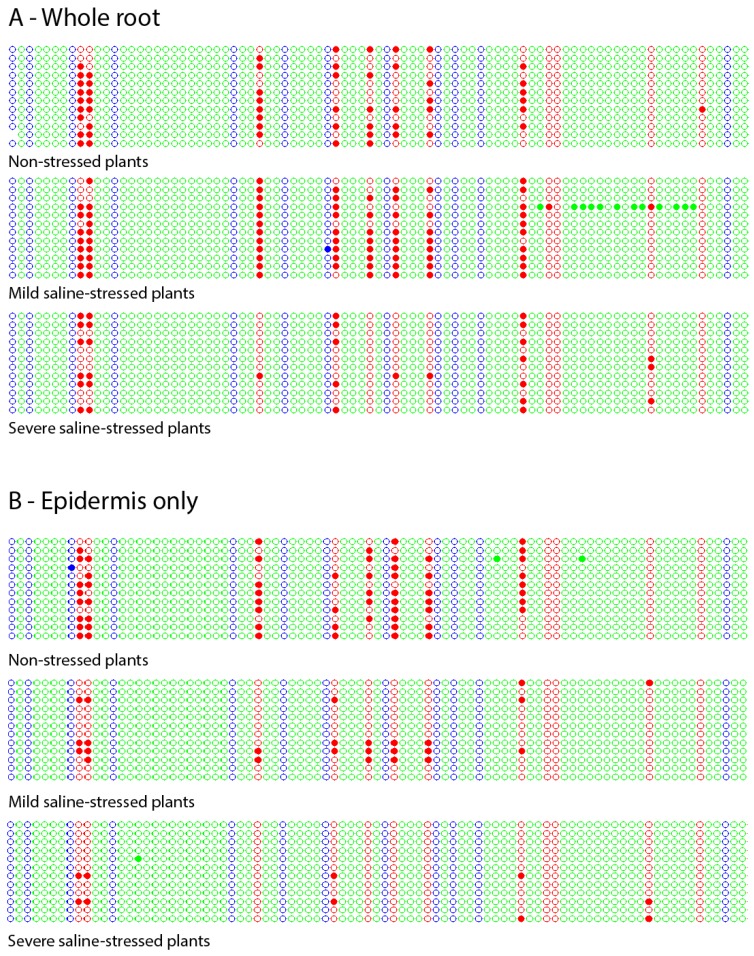
Figure 2.
Kismeth dot plots [20] showing the methylation pattern of a region of GL2 in the root of non-stressed, mild-stressed and severe-stressed plants. (A) Total root. (B) Epidermis. Each line represents one clone, and each circle, one cytosine according to the order 5′–3′ (left–right) in which it appears in the DNA sequence. The colors blue, red and green correspond to cytosines located in the contexts -CHG-, -CG- and – CHH-, respectively. The filled circles indicate methylated cytosines, while the empty circles represent the unmethylated ones.

