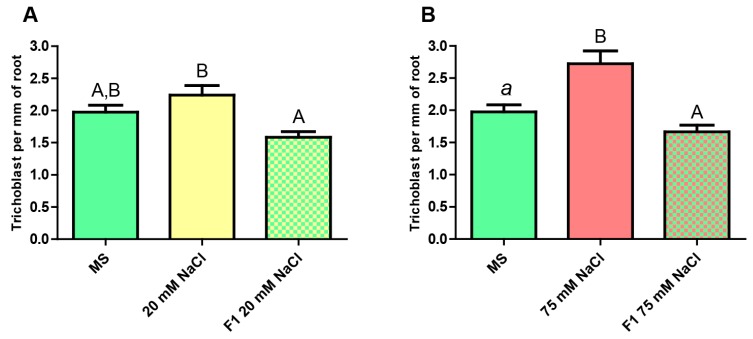
Figure 6.
Estimation of the number of trichoblasts present per mm of principal root in pExp7::GFP plants. (A) From left to right: unstressed F0 (MS), mildly stressed F0 (20 mM NaCl), unstressed F1 progeny of mildly stressed F0. (B) From left to right: unstressed F0 (MS), severely stressed F0 (75 mM NaCl), unstressed F1 progeny of severely stressed F0. One-Way ANOVA and Bonferroni post-test. The columns labeled with the same letter show non-significant differences. Different letters indicates statistically significant differences. At least one small letter indicates p < 0.05; one small letter in italics and bold indicates p < 0.01. A couple of capital letters indicates p < 0.001. The error bars indicate standard error of the mean (SEM).

