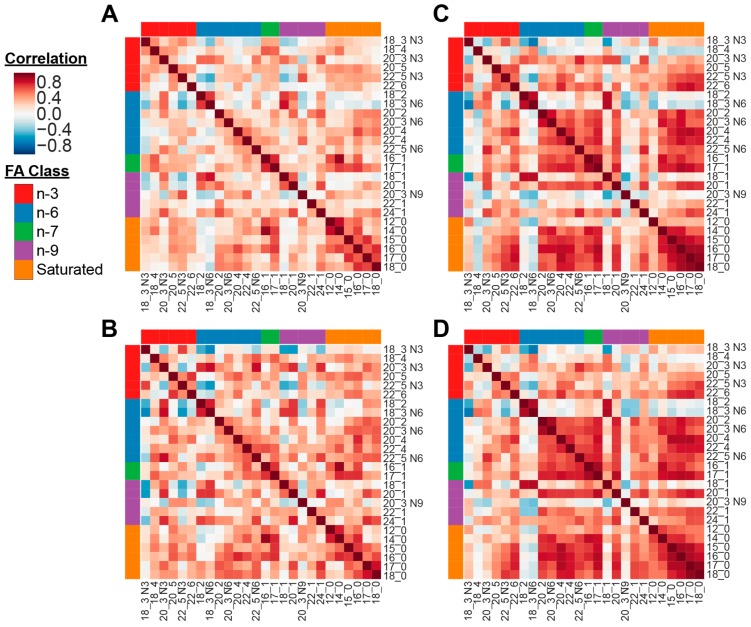
Figure 1.
Heatmaps representing pairwise correlations between all fatty acids in anorexia nervosa (A (fasting) and B (postprandial)) and healthy controls (C (fasting) and D (postprandial)). Fatty acid classes (n-3, n-6, n-7, n-9, and Saturated) are indicated by the color bars on the top and left side of the heatmaps. In the heatmap, red represented higher correlation, and blue shows lower correlation between a pair of markers. (A) AN group at fasting timepoint. (B) AN group at postprandial timepoint. (C) Control group at fasting timepoint. (D) Control group at postprandial timepoint.

