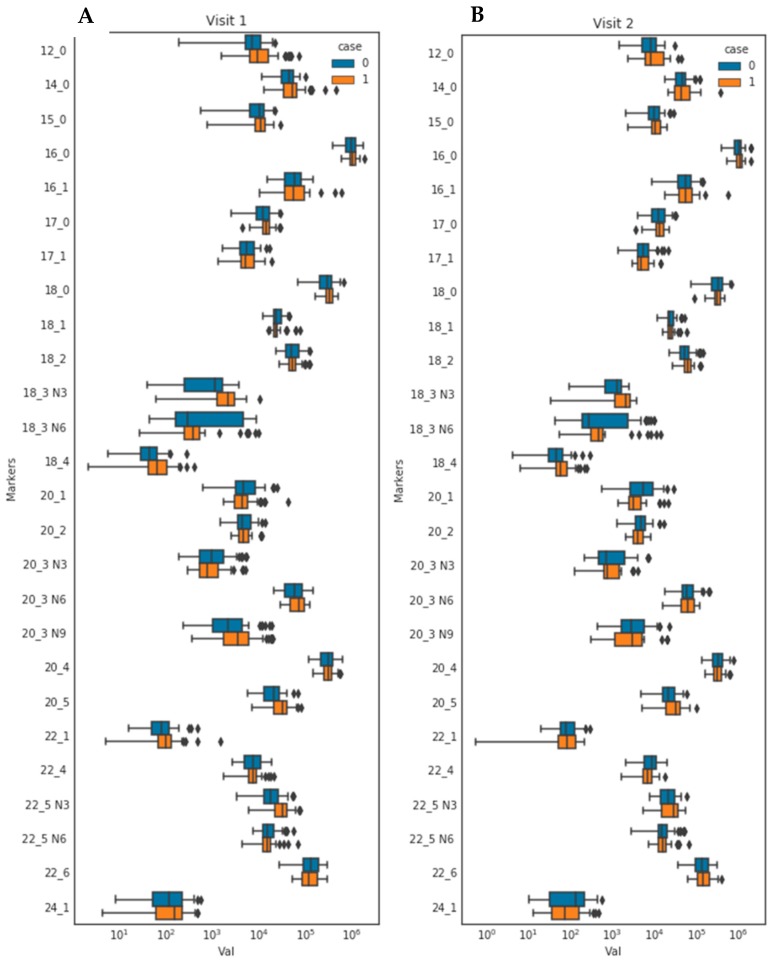
Figure 2.
Boxplots representing distribution of each fatty acid in anorexia nervosa group (Orange) and control group (Blue). Orange bars: AN group; blue bars: control group. Visit 1 (A) refers to the fasting timepoint, Visit 2 (B) refers to the postprandial timepoint (two hours after eating a standardized sandwich). The pairwise similarity was determined using the Pearson correlation between FA concentrations and plotted using seaborn clustermap in Python. T-test with false discovery rate (FDR) adjustment was used to determine statistical differences between AN and control groups for each individual fatty acid.

