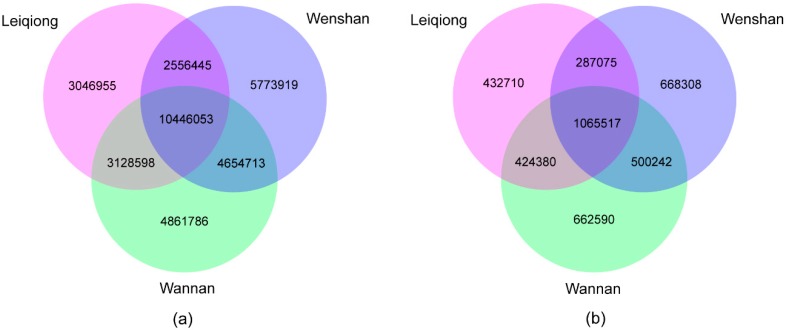
Figure 2.
Venn diagram describes overlap and unique SNPs/InDels between the three breeds (LQ, WN, WS). The numbers show specific SNPs/InDels for each breed or overlapping SNPs/InDels between any two breeds or among three breeds. (a) The identified shared and specific SNPs for each breed. (b) The identified shared and specific InDels for each breed.

