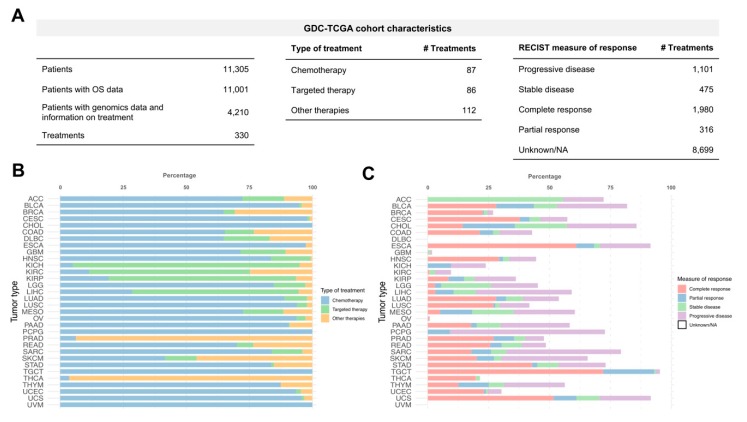
Figure 1.
Genomic Data Commons effort and The Cancer Genome Atlas (GDC-TCGA) cohort description. (A) Tables showing total number of patients and drugs administered, type of treatments received and Response Evaluation Criteria in Solid Tumours (RECIST) measure of response in GDC-TCGA cohort. (B) Percentage of treatments received by tumour type. Bar colour represents the type of anticancer therapy (targeted therapy, chemotherapy and other therapies such as hormone therapy, immunotherapy and ancillary therapies). (C) Percentage of treatments with measure of response by tumour type. Bar colour represents the different measures of response following the RECIST guidelines.

