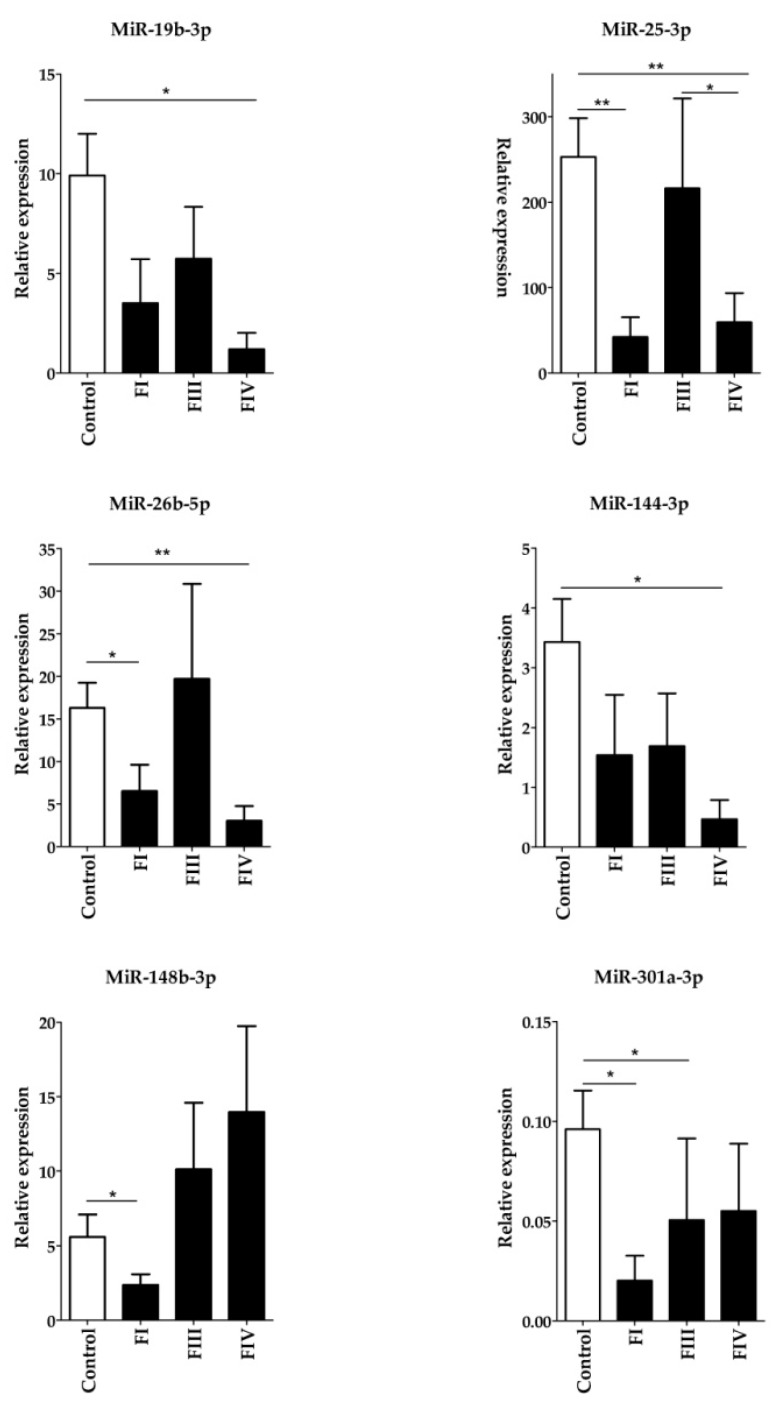
Figure 2.
Validation of six randomly chosen significantly differentially expressed Group 1 miRNAs using the RT-qPCR measurement. Expression levels of plasma miRNAs were compared between ovarian cancer patients and control females. Total miRNA was isolated from plasma samples and the amounts of mature hsa-miRNAs was determined by the miScript PCR System. The expression of PCR products was normalized to hsa-miR-103-3p and relative miRNA expression levels were determined by the 2-∆Ct method. All measurements were done in triplicate. Data distribution was analyzed by the Kruskal–Wallis one-way ANOVA test with Dunn’s post-hoc analysis, p-values shown in the figure are as follows: *: P < 0.05; **: P < 0.01.

