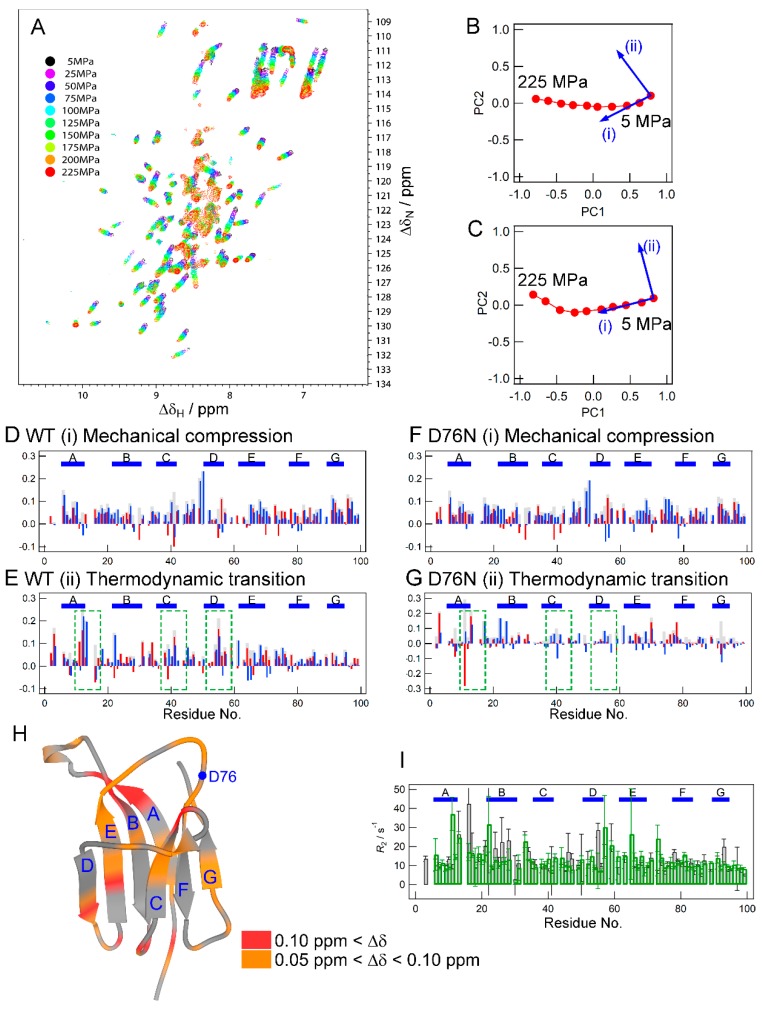
Figure 3.
Data analyses of high-pressure NMR measurements. (A) Overlay of the 1H–15N HSQC spectra of wild-type β2m obtained at pressures ranging between 5 and 225 MPa. Spectral colors indicate the hydrostatic pressures at which measurements were performed. (B,C) The principal component (PC) planes of the pressure-dependent spectral changes for WT (B) and D76N (C) obtained from the singular value decomposition (SVD) procedure. A point on the plane corresponds to one spectrum. The rightmost point corresponds to the spectrum obtained in the initial conditions (5 MPa). The blue arrows indicate the supposed directions of the conformational changes corresponding to (i) mechanical compression and (ii) thermodynamic transition. (D–G) Calculated ∆δ patterns for (i) mechanical compression and (ii) thermodynamic transition for WT (D,E) and D76N (F,G), respectively, from the PCA-based analysis. Blue and red lines show chemical shift changes (in ppm) in the 15N and 1H directions, respectively. The ∆δ values for 15N were divided by 5. The gray bars are the ∆δapp values calculated by Equation (2). (H) The mapping of residues with significant ∆δ values in the (ii) thermodynamic transition for WT (panel E) on the crystal structure. Colors indicate the ∆δ values as shown by the color gauge below. (I) Comparison of the R2 profile of wild-type β2m under ambient pressure conditions (condition WT(AP), gray bars) with those at 100 MPa (condition WT(HP), green bars).

