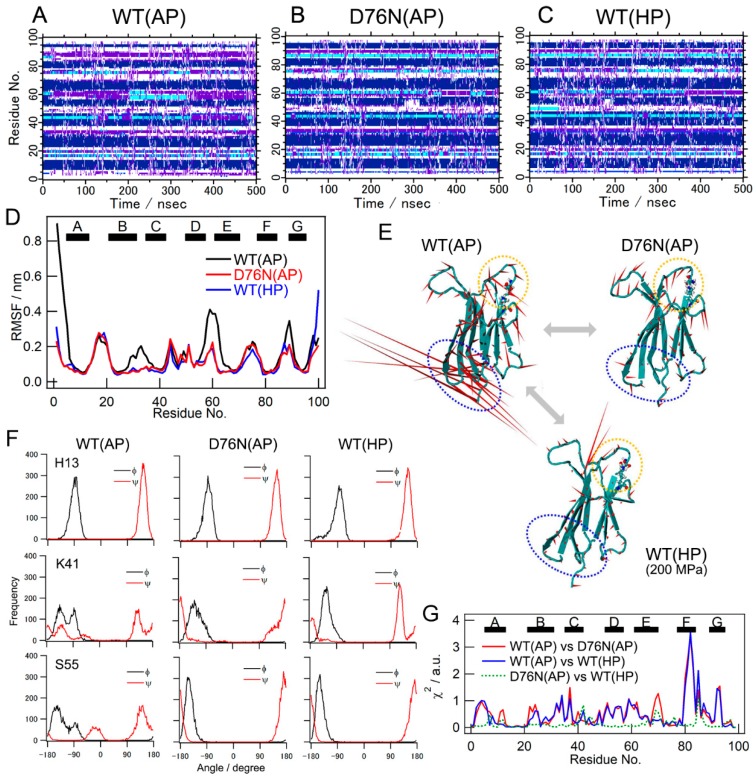
Figure 4.
Results of molecular dynamic (MD) simulations. (A–C) Time evolution of the secondary structure profile observed under condition WT(AP): WT at ambient pressure (A), condition D76N(AP): D76N at ambient pressure (B), and condition WT(HP): WT at 200 MPa (C). Individual colors indicate the secondary structures according to the DSSP definition; blue: isolated β-bridge, deep blue: extended strand, cyan: hydrogen-bonded turn, purple: bend. (D) Root mean square fluctuations (RMSFs) calculated for individual simulation conditions. The black, red, and blue lines show RMSF for conditions WT(AP), D76N(AP), and WT(HP), respectively. (E) Visualizations of the dominant motions under individual simulation conditions. The first eigenvector values calculated by PCA of MD data are represented as dominant motions. The directions of the residues observed in the first PC were indicated by the red spikes. The blue and orange broken circles indicate the positions of the DE loop and mutation site, respectively. (F) The distribution of the dihedral angles of the representative residues, His13, Lys41, and Ser55 under conditions WT(AP), D76N(AP), and WT(HP). (G) χ2 values as an indicator of the degree of the difference between dihedral angle distributions under individual simulation conditions.

