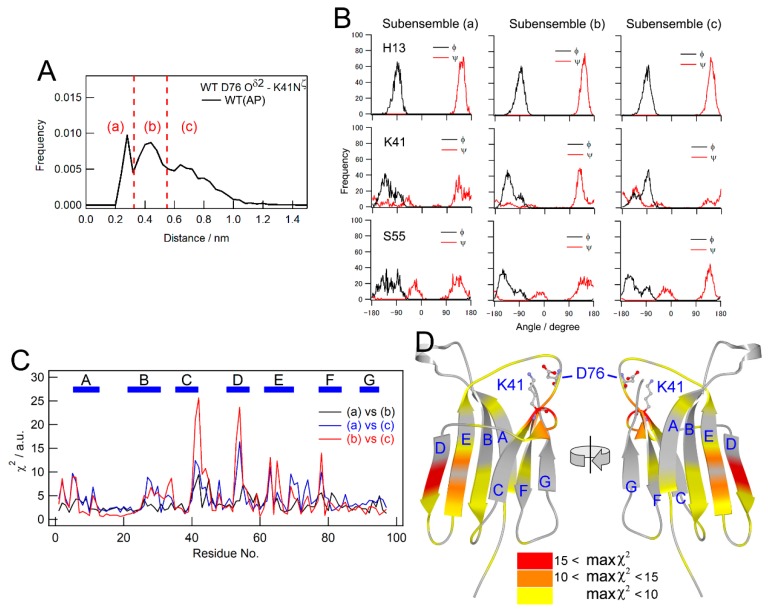
Figure 6.
Correlation of dynamics between main chain conformations for all residues and the mutation site. (A) The distribution of distance between D76 and K41 side chains for WT at ambient pressure. The dotted lines are the borders separating the three subensembles, named (a), (b), and (c), of the conformation with different side chain distances. (B) The dependence of the dihedral angles of the representative residues (H13, K41, and S55) on the distance between the D76 and K41 side chains. (C) χ2 values as an indicator of the degree of the dependence of the dihedral angle distribution on the D76-K41 side chain distance. (D) The mapping of max χ2 values among those obtained for the three combinations ((a) vs. (b), (a) vs. (c), and (b) vs. (c)) on the crystal structure. Colors indicate χ2 values, as shown by the color gauge below.

