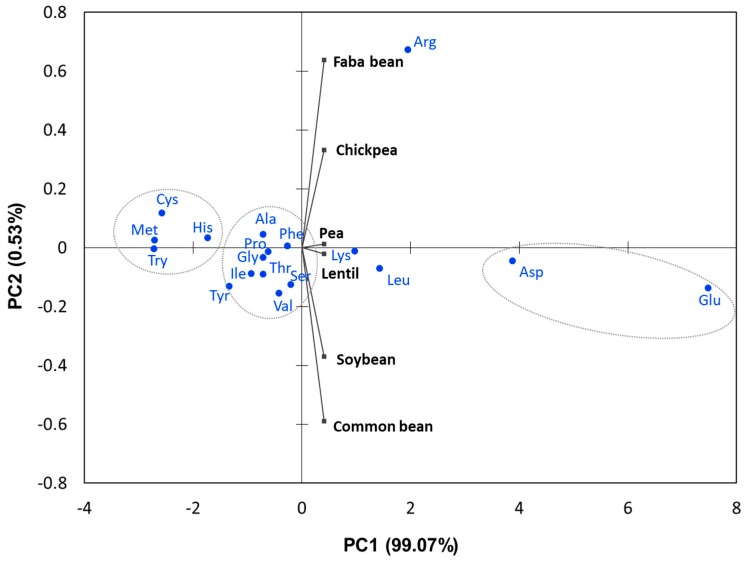
Figure 1.
Principal component analysis (PCA) of amino acid data (meta-analysis) from Table 2. The biplot shows amino acid data and legume crops as vectors. Vectors that are close together are correlated in terms of the observed amino acid pool for each crop. PCA analysis was employed to illustrate relationships between amino acids and legume species using the R statistical package (R Development Core Team, 2018, www.Rproject.org).

