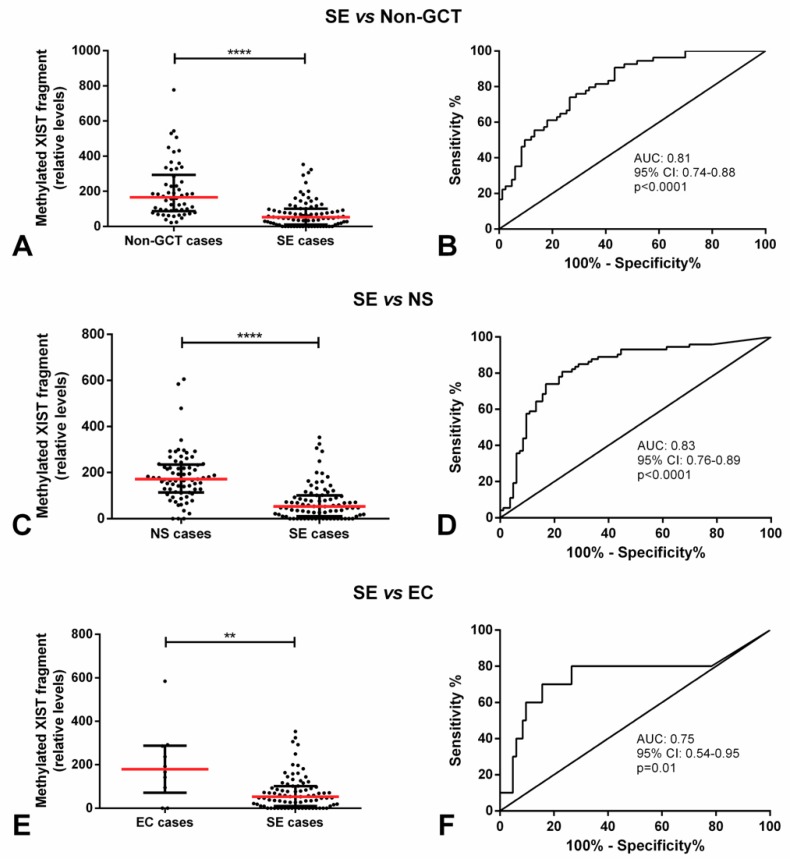
Figure 3.
Methylated XIST fragment relative amounts in seminoma patients of the discovery cohort. Relative amounts of the methylated XIST fragment in pure seminoma patients and (A) no evidence of TGCT, respective receiving operator characteristic (ROC) curve in (B); (C) NS, respective ROC curve in (D); and (E) only pure embryonal carcinoma (EC), respective ROC curve in (F). **** indicates p < 0.0001 and ** indicates p < 0.01. Abbreviations: AUC—area under the curve; EC—embryonal carcinoma; GCT—germ cell tumor; NS—non-seminoma; SE—seminoma.

