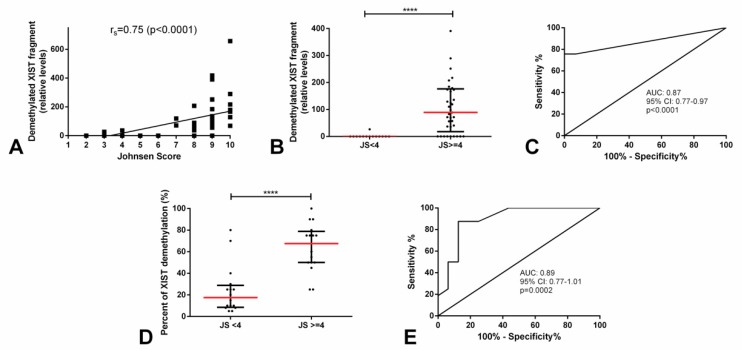
Figure 8.
Demethylated XIST fragment relative amounts in testicular parenchyma with various Johnsen’s scores (discovery and validation cohorts). (A) Correlation between Johnsen’s score and relative amounts of demethylated XIST fragment; (B) relative amounts of the demethylated XIST fragment in high and low Johnsen’s score groups, respective ROC curve in (C); and (D) percentage of the demethylated XIST fragment in high and low Johnsen’s score groups, respective ROC curve in (E). **** indicates p < 0.0001. Abbreviations: AUC—area under the curve and JS—Johnsen’s score.

