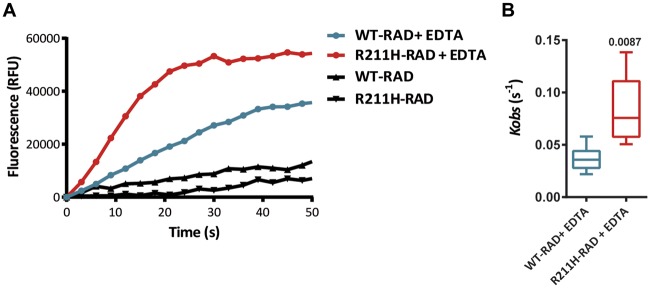
Figure 7.
RAD protein GTPase activity analysis. (A) Representative fluorescence kinetics traces of WT-RAD and R211H-RAD GDP/GTP-mant exchange in the presence or absence of EDTA. (B) Box plot of Kobs values of EDTA-induced GDP/GTP-mant exchanges in WT-RAD (n = 6) and R211H-Rad (n = 5) cardiomyocytes. Statistical test: Mann–Whitney test.

