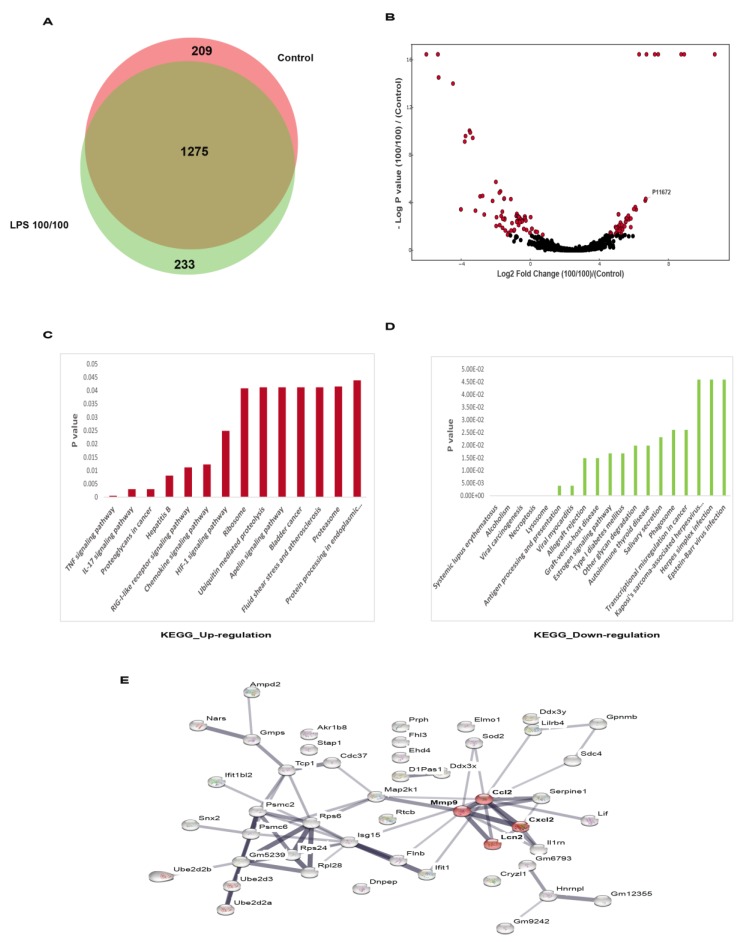
Figure 2.
The volcano plot analysis of proteomic from supernatant of RAW264.7 cells after sequential lipopolysaccharide (LPS) stimulation (LPS tolerance; LPS/LPS) compared with control (N/N) (see method) demonstrated down- and up-regulated proteins (A) and the Venn diagram indicated the different number of proteins from LPS tolerance (LPS/LPS) group versus the control (B). Additionally, pathway analysis clusters (DAVID) of up- and down-regulated proteins (C,D) and the enriched pathway of the proteins in LPS/LPS compared with the control (E) were demonstrated.

