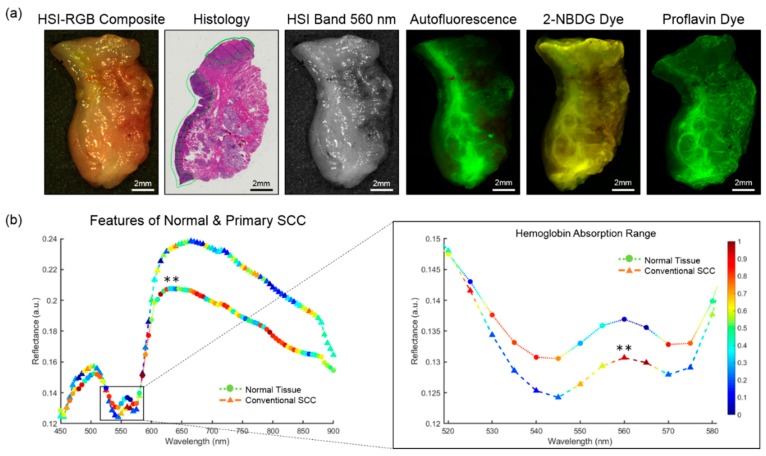
Figure 1.
A representative cancer-involved tissue specimen of conventional, keratinizing SCC of the mandibular gingiva. (a) From left to right: RGB image made from HSI. The histological image, which serves as the ground truth, has SCC annotated in green. HSI single band at 550 nm. Fluorescence imaging modalities of the same specimen; (b) Spectral feature saliency from CNN gradients of correctly classified HSI for conventional SCC and normal upper aerodigestive tract tissues. Left: Full spectra from 450 to 900 nm of SCC and normal tissues. Symbol colors represents the relative, scaled importance of the spectral feature for making the correct prediction of cancer or normal from the HSI (0 is low saliency; 1 is high saliency). Right: Spectral cutout from 520 to 580 nm, corresponding to the hemoglobin range. The double asterisk (**) indicates that statistically significant differences (p < 0.01) were observed in reflectance values between SCC and normal for all spectral bands (450 to 900 nm). The most important spectral feature for correctly predicting SCC in HSI was the oxygenated hemoglobin peak at 560 and 565 nm.

