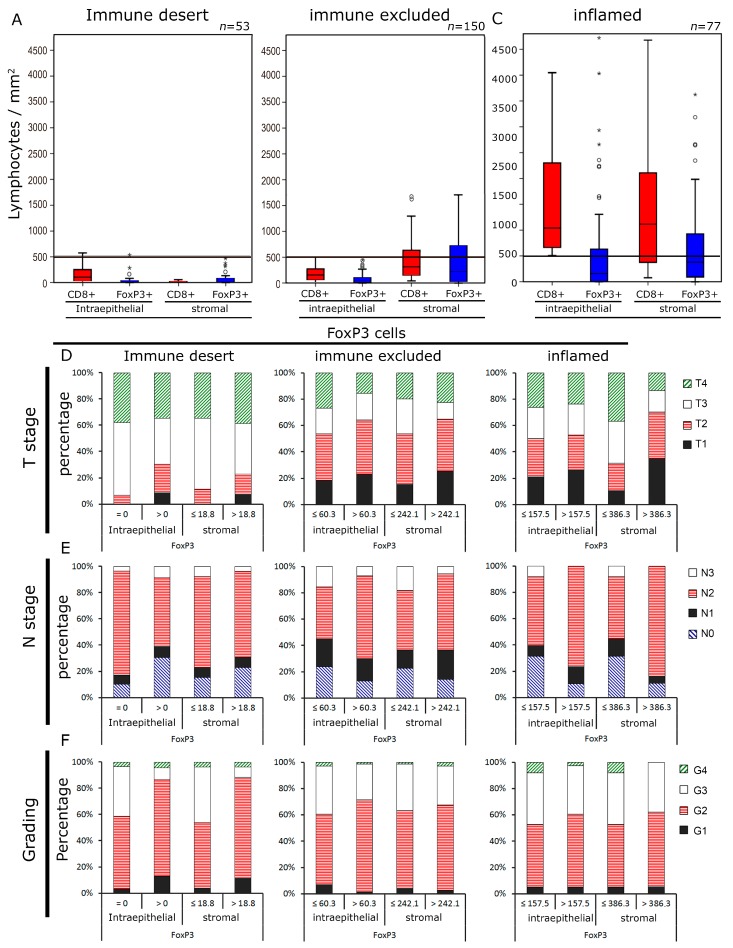
Figure 3.
Lymphocyte densities and clinical characteristics in the “immune desert”, “immune excluded” and “inflamed” groups. Lymphocyte densities (cells mm−2) in the intraepithelial and stromal compartment of the “immune desert”. (A) the “immune excluded”. (B) and the “inflamed” group. (C) Tumor size. (D) N stage E and tumor grade. (F) in the three subgroups depending on the FoxP3+ densities are depicted. Cut-off values were the median FoxP3+ densities.

