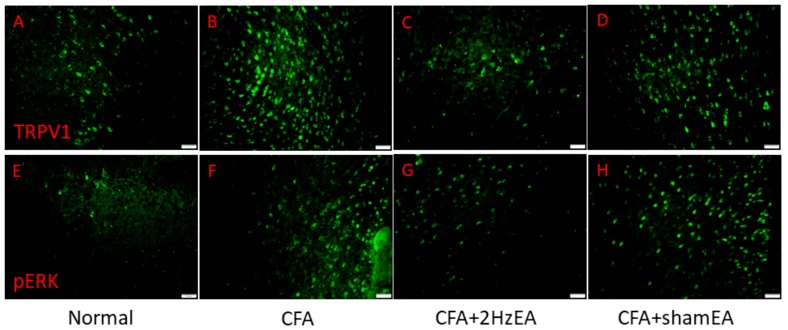
Figure 3.
Expressions of TRPV1 and pERK in the mPFC of normal, CFA, CFA + 2 Hz EA, and CFA + sham EA. TRPV1-positive neurons (green) in the mPFC of (A) normal, (B) CFA, (C) CFA + 2 Hz EA, and (D) CFA + sham EA mice. pERK-positive neurons (green) in the mPFC of (E) normal, (F) CFA, (G) CFA + 2 Hz EA, and (H) CFA + sham EA mice. Scale bar means 50 m.

