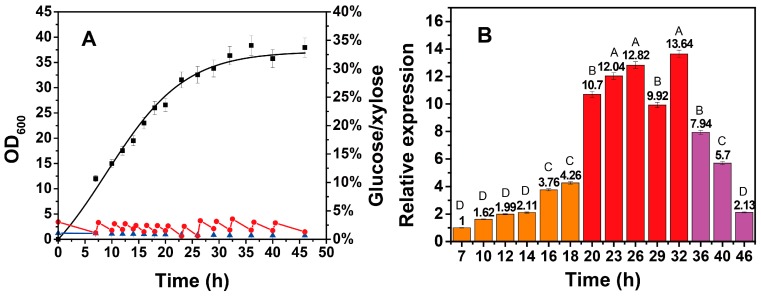
Figure 2.
Growth and sugar consumption curves (A) and relative transcription of the xylose operon (B) in B. licheniformis during the fermentation process. In Figure 2A, the growth curve was obtained using a nonlinear fitting. In Figure 2B, Period I (7–20 h) was considered to be the logarithmic phase; Period II (20–36 h) was considered to be the stationary phase; and Period III (36–46 h) was considered to be the senescent phase. ■—■, OD600; ●—●, glucose concentration; ▲—▲, xylose concentration. In Figure 2B, ▄, first stage; ▄, second stage; ▄, third stage. Results are expressed as mean of replicates, one-way ANOVA followed by a Tukey’s post hoc test statistical analyses were performed. Treatments with different letters (where A > B > C > D) are significantly different at p < 0.01.

