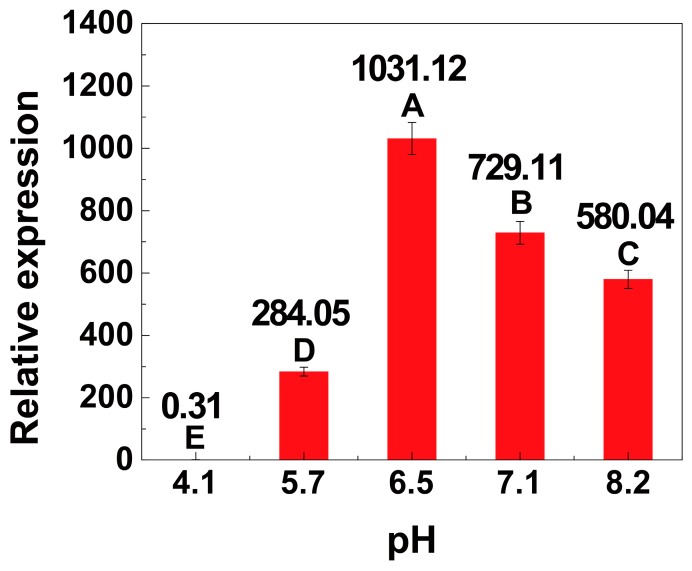
Figure 5.
Relative transcription of the xylose operon in B. licheniformis at different pH values. Results are expressed as mean of replicates, one-way ANOVA followed by a Tukey’s post hoc test statistical analyses were performed. Treatments with different letters (where A > B > C > D > E) are significantly different at p < 0.01.

