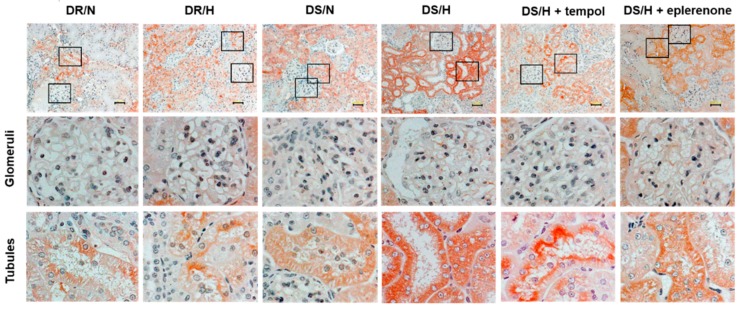
Figure 3.
Immunohistochemistry of vanin-1 in rat kidney tissues. Representative images of kidney cortical regions. Magnified views of glomeruli and tubules are from the indicated black boxes. Vanin-1 expression was localized both around the injured tubules and within a subset of injured tubules, but not in the glomeruli. Scale bar, 50 μm.

