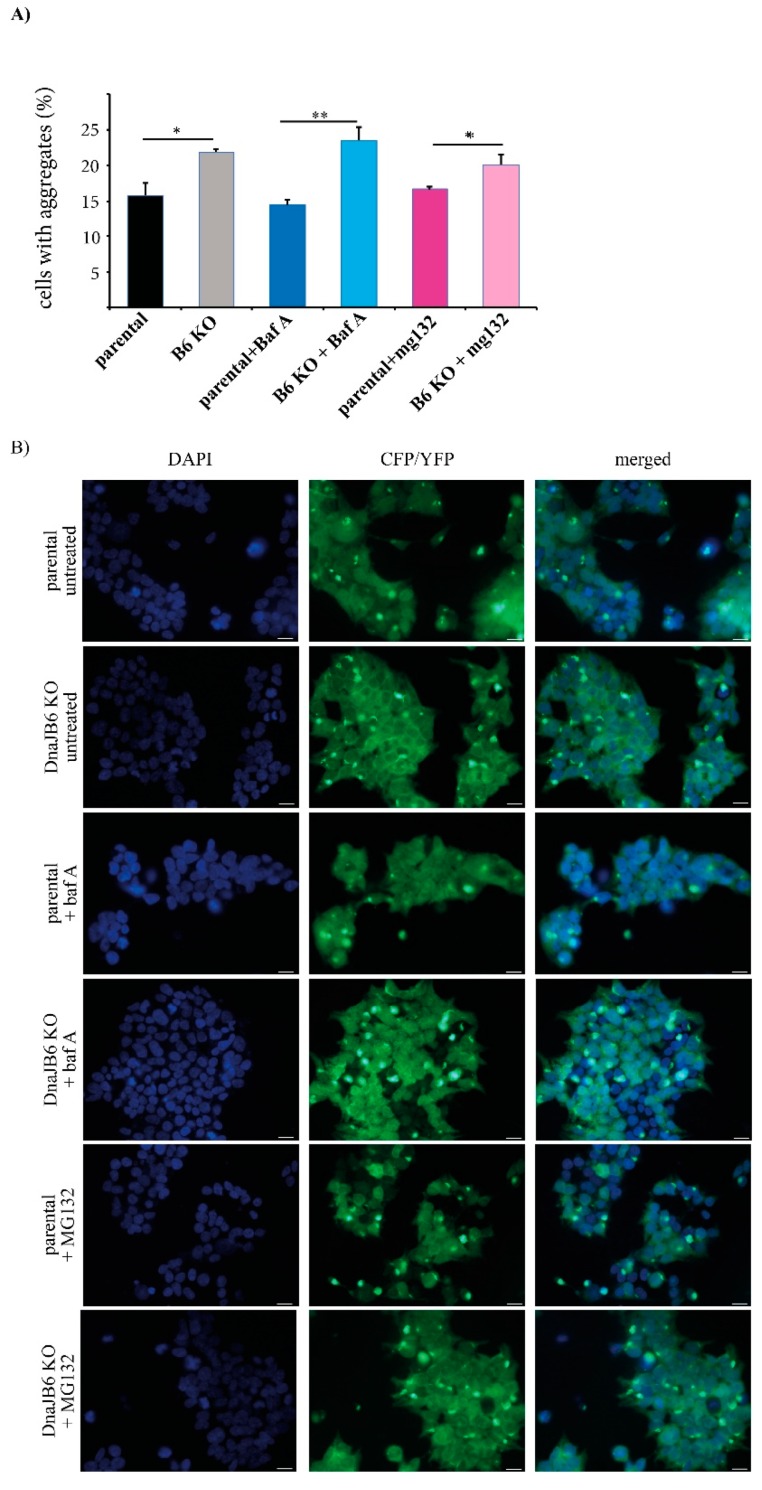
Figure 4.
Effect of the lysosomal or proteasomal inhibitor treatment on the α-Syn PFF-induced aggregation of α-Syn in α-Syn CFP/YFP HEK293 cells analyzed by immunofluorescence microscopy. (A) Quantification of the percentage of DAPI-positive parental and DNAJB6 KO cells displaying CFP/YFP positive aggregates as counted using flourescence microscopy (15.8 ± 0.962; 21.9 ± 0.233; 14.5 ± 0.472; 23.5 ± 1.11; 16.6 ± 0.218; 20.1 ± 0.837). The cells were transfected with 10 nM α-Syn PFFs for 48 h, and treated (or not) with 100 nM of bafilomycin A or 25 µM of MG132 for 2 h. (B) Representative pictures of the fixed parental and DNAJB6 KO α-Syn FRET HEK293 cells and DAPI stained after three days of culture following transfection with 10 nM of α-Syn PFFs for 48 h. The cells were either not treated (untreated), or treated with 100 nM bafilomycin A for 2 h or 25 µM MG132 for 2 h. Magnification 40×. Data were analyzed by the Student’s t-test and are represented as mean ± SD: * p <0.05; ** p <0.01 (n = 3). Scalebar: 20 µm.

