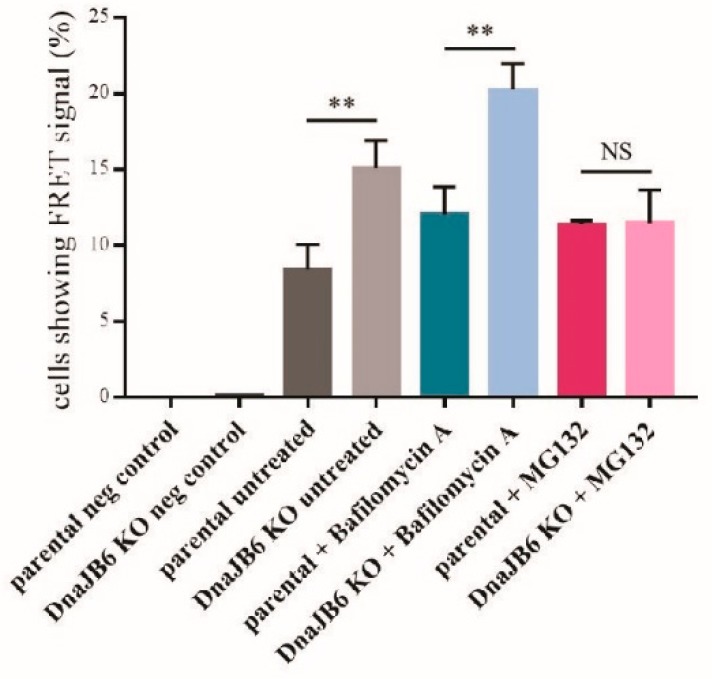
Figure 5.
The α-Syn PFF-induced aggregation of α-Syn following lysosomal or proteasomal inhibitor treatment in α-Syn CFP/YFP HEK293 cells analyzed by FRET. Quantification of the percentage of alive and single α-Syn FRET HEK293 cells producing a FRET signal, as detected by BD LSRFortessa™. The cells had been transfected with 10 nM α-Syn PFFs for 48 h, and were treated (or not) with 100 nM bafilomycin A for 2 h or 25 µM MG132 for 2 h. The data were analyzed by the Student’s t-test and are represented as mean ± SD: ns p > 0.05 * p < 0.05; ** p < 0.01 (n = 3); 0.0; 0.1; 8.4 ± 0.95; 15.1 ± 1.06; 12 ± 1.05; 20.3 ± 0.984; 11.4 ± 0.145; 11.5 ± 1.24).

