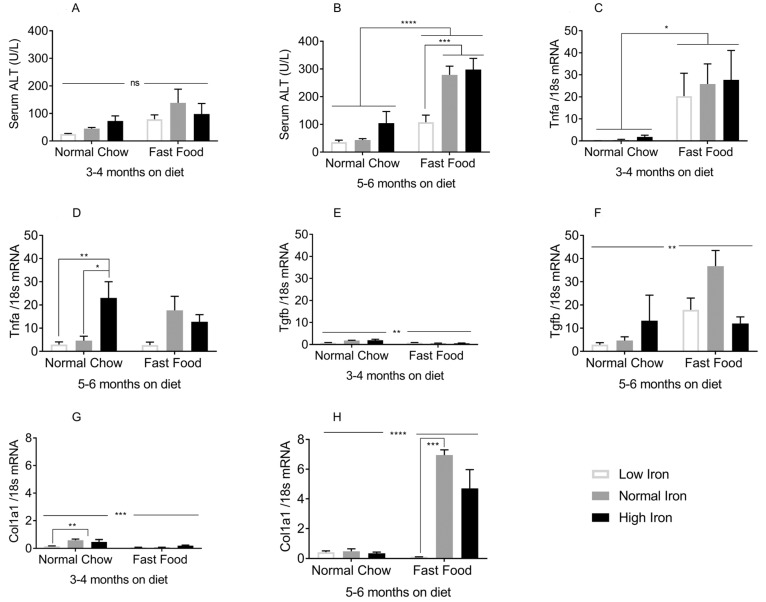
Figure 4.
Effects of dietary iron and FF on NASH biomarkers: (A,B) Serum ALT at 3–4 and 5–6 months (n = 3–11 per group). (C,D) Tumor necrosis factor alpha (Tnfa) mRNA at 3–4 and 5–6 months (n = 3–5 per group). (E,F) Transforming growth factor beta (Tgfb) mRNA at 3–4 and 5–6 months (n = 3–5 per group). (G,H) of collagen1alpha1 (Col1a1) mRNA at 3–4 and 5–6 months (n = 3–5 per group). All genes were normalized to 18sRNA. Shown are means ± SE. p values were calculated with ordinary two-way ANOVA with post hoc Tukey’s multiple comparisons test. ns: not significant, i.e., p ≥ 0.05; * 0.01 ≤ p ≤ 0.05; ** 0.001 ≤ p ≤ 0.01; *** 0.0001 ≤ p ≤ 0.001; **** p < 0.0001.

