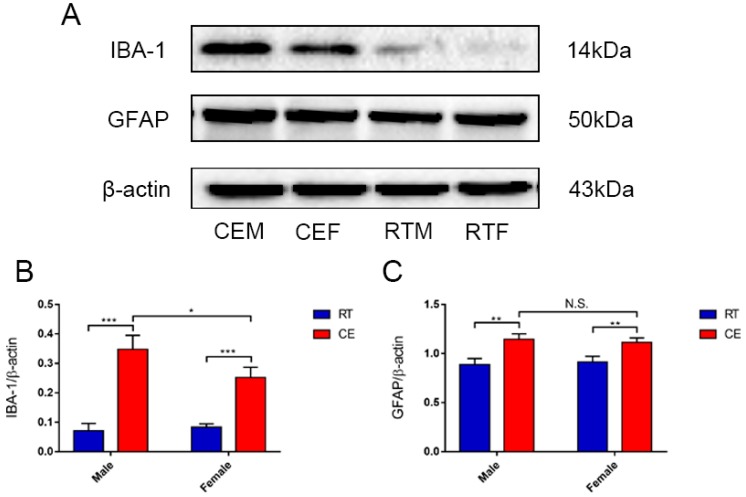
Figure 2.
Expression of glial cell makers in hippocampal tissue lysates of cold-stressed mice, as determined by western blotting and densitometric analysis. (A) IBA-1, glial fibrillary acidic protein (GFAP), and β-actin levels in each group. (B,C) Quantification of expression levels based on expression ratios of IBA-1/β-actin (B) and GFAP/β-actin (C). Differences between room temperature male (RTM) and cold exposure male (CEM), room temperature female (RTF) and cold exposure female (CEF), and CEM and CEF groups were evaluated by two-way analysis of variance. Results are expressed as the mean ± SD (n = 6) of four independent experiments. N.S.: not significant; * p < 0.05, ** p < 0.01, *** p < 0.001.

