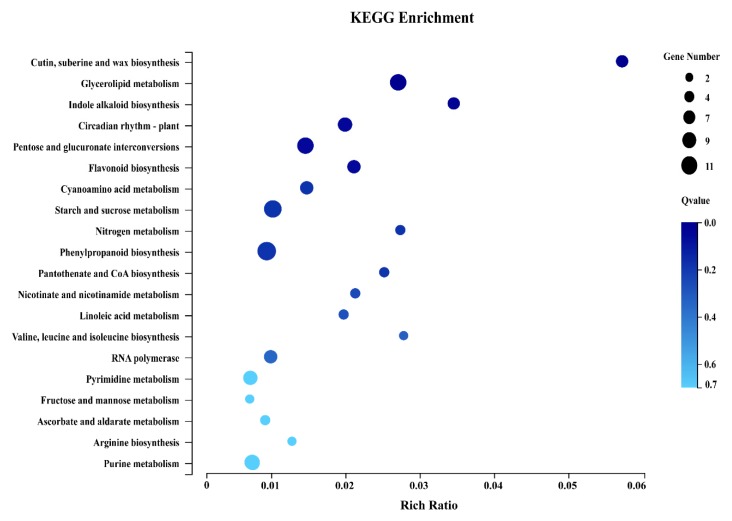
Figure 3.
Bubble diagram of enrichment of KEGG pathway. X axis for the enrichment Ratio (selected genes concentrated annotation to a particular item number comments to this entry with this species the Ratio of the total number of genes, calculating formula for Rich thewire = Term Candidate Gene Num/Term Gene Num). Y axis to KEGG Pathway, the size of the bubbles represented annotation to a KEGG Pathway on the number of genes, color represents enrichment Qvalue value, the deeper the color represents the Qvalue value is smaller.

