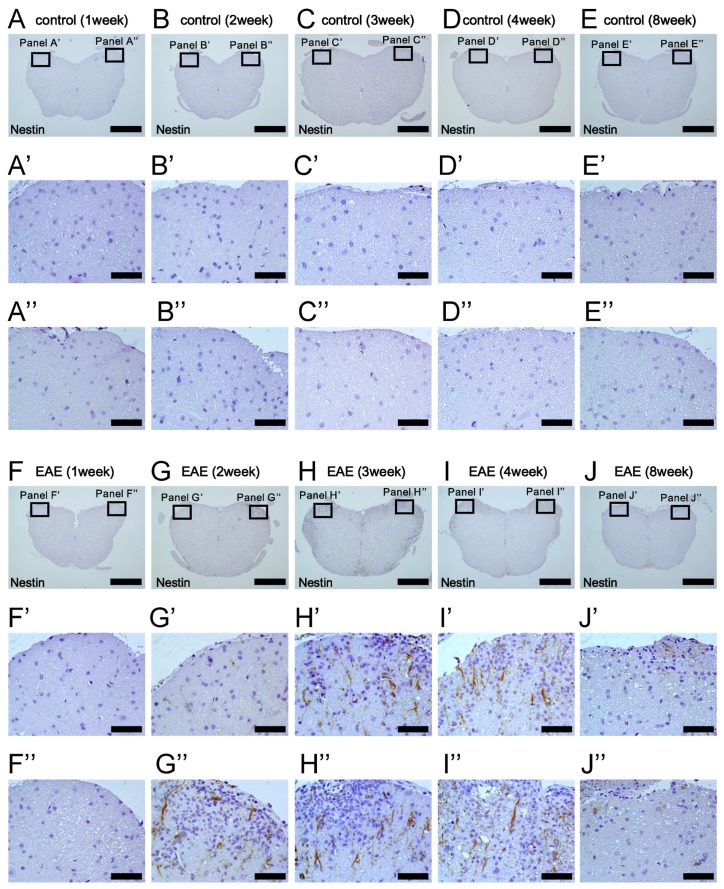
Figure 6.
Immunohistochemical analysis for Nestin expression of lumbar spinal cord at 1 (A, A’, A’’, F, F’, and F’’), 2 (B, B’, B”, G, G’, and G’’), 3 (C, C’, C’’, H, H’, and H’’), 4 (D, D’, D’’, I, I’, and I’’), and 8 weeks (E, E’, E’’, J, J’, and J’’) after treatment in control (A–E, A’–E’, and A’’–E’’) and EAE mice (F–J, F’–J’, and F’’–J’’). Although Nestin was rarely expressed in control mice (A–E, A’–E’, and A’’–E’’), many Nestin+ cells were observed at 3 (H, H’, and H”) and 4 weeks after MOG injection (I, I’, and I”). Results displayed are representative of three replicates (N = 3). Scale bars = 500 µm (A–J) and 50 µm (A’–J’, A”–J”). Abbreviations: EAE, experimental autoimmune encephalomyelitis; MOG, myelin oligodendrocyte glycoprotein.

