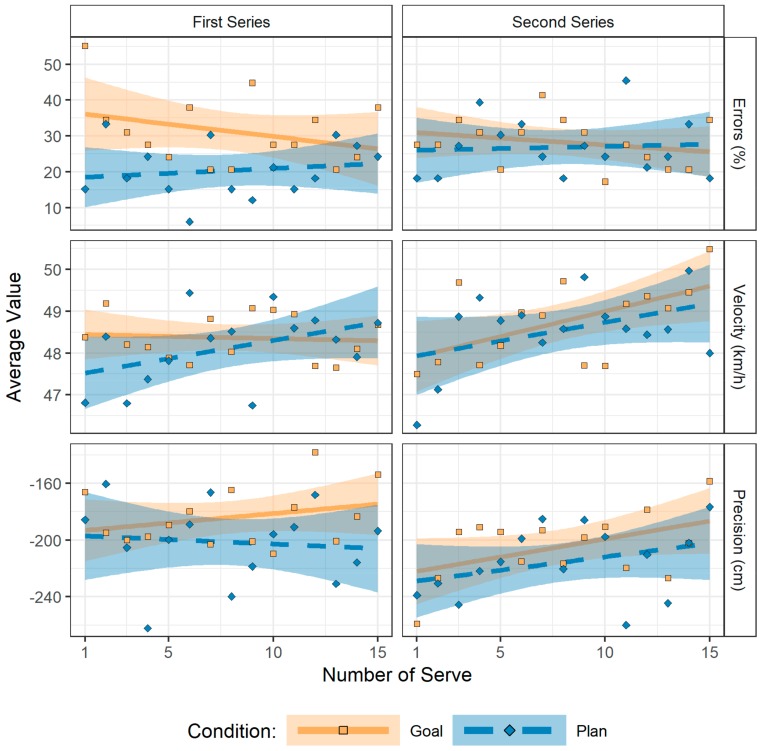
Figure 2.
The development of performance during the first and the second series of serves. Performance was stable during the first series of serves. During the second series, there were drops in performance regarding velocity and precision with subsequent recovery. Dots represent average values per condition and number of serve, lines represent an ordinary least square regression line through these points along with a 95% confidence interval.

