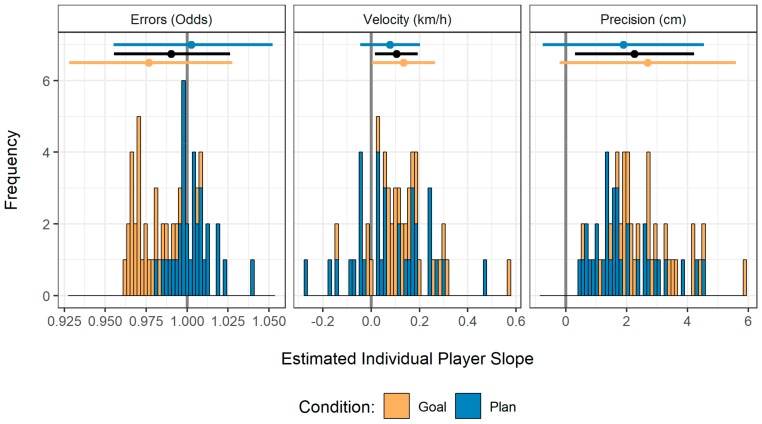
Figure 3.
Stacked histograms of the estimated individual player slopes for each performance indicator in the second series of serves, separately for the goal and the plan condition. The upper part displays average slopes along with a 95% confidence interval. The black lines represent an aggregation across conditions.

