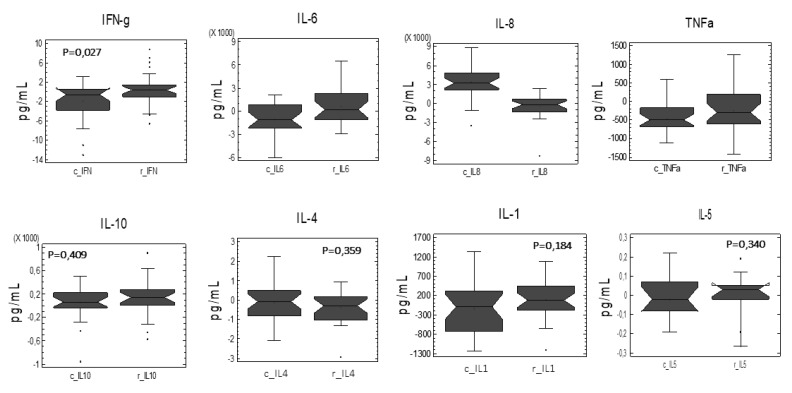
Figure 3.
Paired comparisons of the relative variation of each cytokine as a function of the treatment applied. The analysis revealed an increased cellular capacity in response to the LPS stimulation regardless of IFNγ (4-fold, p = 0.027) and IL-6 (1.9-fold, p = 0.011), while decreased IL-8 (6.6-fold, p = 0.001) levels of the CR group compared to control group.

